Can we predict token usage using transformer based models?
OpenRouter's top 50 with 21 Time Series Foundation Models, measuring the latest time series foundation models against real-world patterns.
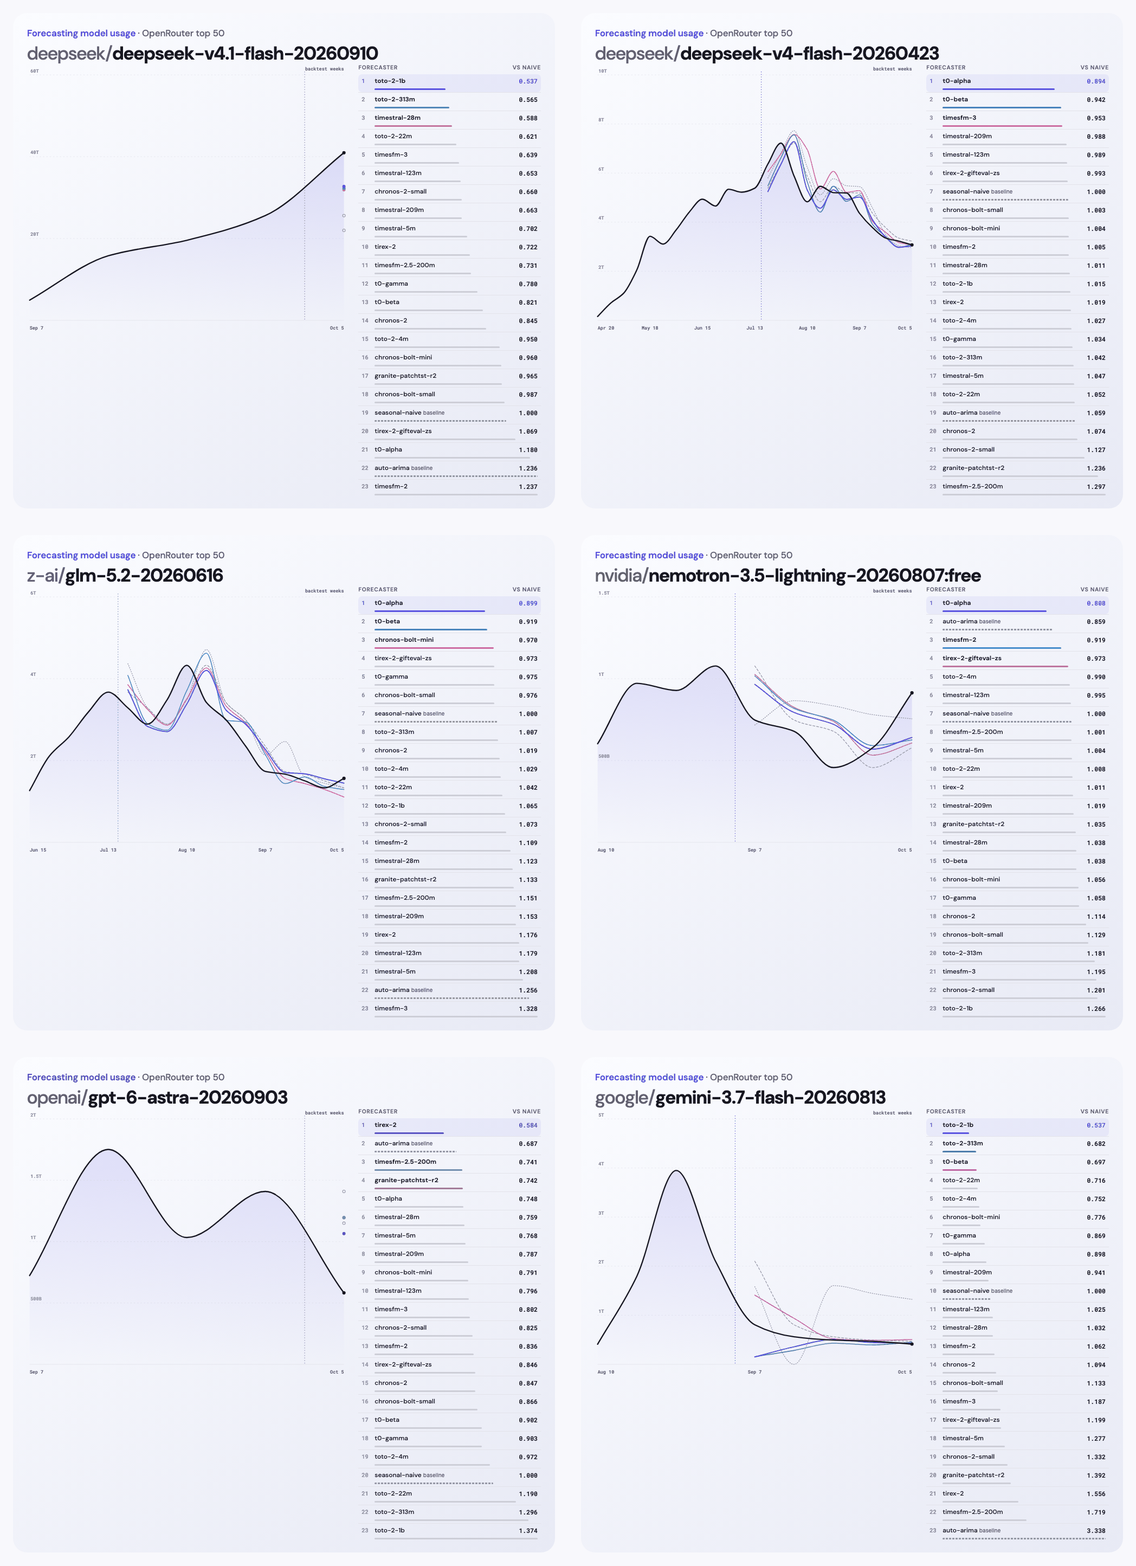
Time Series Foundation models or classical methods?
Time series foundation models are one of the newest ideas in forecasting. Like a lot of things in machine learning and AI right now, there's a heated debate over whether they actually work.
Rob Hyndman made the skeptical case really well in a recent post [1]. He points out that published comparisons often use weak statistical baselines [2], that the datasets in public benchmarks keep showing up in the models' training data [3], and that a leaderboard averages over so many domains that it can hide how a model does on the series that actually matter. He closes with a key thought.
“A model that tops a MASE leaderboard by a small margin but takes an order of magnitude longer to run, or performs poorly on genuinely new data, may be the wrong choice operationally even if it’s the ‘best’ model on paper.” [1]
Hyndman's advice to backtest properly on real data, with well-implemented baselines, points at the part that's easy to underestimate. Much of the hard work in testing time series foundation models is the engineering pipeline. Every model comes with its own requirements, architecture and input format, and until recently it was hard to test them at scale or to recreate the conditions behind a benchmark score like GIFT-Eval [4] or fev-bench [5].
FoundationForecast, our newly released open-source unified API for time series foundation models, takes care of that part. It runs every model in this test through one interface, so their actual performance can be checked on the same data in the same way. Results are still coming in, and there's no definitive answer yet on whether these models beat older methods. In this test, though, the evidence leans their way at the horizons that matter most in practice. On daily data, every one of the 21 foundation models beat both statistical baselines on individual LLMs over a 7-day horizon.
That practical angle is the focus here. For most companies a forecast 1 day out is too short to act on, and 4 weeks out is often too long to trust, so a week ahead is where a lot of planning happens. That makes it interesting that some of these models do well at 7 days and 1 week ahead. And few series are moving as fast right now as token usage.
Why tokens
Tokens make a good test because they're turning into a unit of economic activity. They're what AI providers sell, what cloud companies count, and more and more, what companies budget for. Google said it processed 9.7 trillion tokens a month across its products in 2024, roughly 480 trillion a year later, and over 3.2 quadrillion a month by May 2026 [6]. In the same talk Sundar Pichai said “many companies are already blowing through their annual token budgets, and it’s only May.” Satya Nadella told Microsoft investors that the key metric the company optimizes for is “tokens per watt per dollar,” and that over 250 customers were on track to process over a trillion tokens each on its Foundry platform that year [7].
The mix is changing fast too. A study of over 100 trillion tokens on OpenRouter found that reasoning models went from a negligible share in early 2025 to more than half of all tokens by late 2025, and that the average prompt grew about fourfold [8]. Agentic coding tasks can use about 1,000 times more tokens than code chat, and the same task can vary by up to 30x in tokens from one run to the next [9]. Meanwhile the price of a fixed level of performance has been falling anywhere from 9x to 900x per year, depending on the task [10].
Put together, that makes token volume a number worth forecasting. It drives compute bills, capacity planning and pricing, and it moves fast enough that last quarter's trend can be wrong by next quarter. It's also a real-world series that isn't part of GIFT-Eval or fev-bench, which makes it a fair test of whether benchmark results carry over.
What was tested
OpenRouter publishes weekly token totals for its top 50 models, plus breakdowns by use case and by language. The data runs from January 2025 through the week of October 5, 2026, and the test looks at it at four levels.
- All OpenRouter tokens. One series, the whole platform.
- By category. 12 series like programming, roleplay, marketing and science.
- By language. Natural language vs programming languages.
- By model. The current top 50 models. Many of them are only a few weeks old, so a model joins the test once it has 8 weeks of history. That left 24 models for 1-week-ahead forecasts and 19 for 4 weeks ahead.
Twenty-one foundation models and seasonal naive (which repeats last week's value) ran through FoundationForecast's hosted API. AutoARIMA isn't on the API, so it ran locally with statsforecast. For each of the last 12 weeks, every model saw only the data up to that week and forecast the weeks after it, 1 week ahead and 4 weeks ahead. That's the rolling-origin backtest Hyndman recommends [1], and the scored weeks run from mid-July to early October 2026.
We used MASE as our evaluation metric. MASE, the mean absolute scaled error, was introduced by Rob Hyndman and Anne Koehler, who argued that it should “become the standard measure for comparing forecast accuracy across multiple time series” [11]. MASE is one metric among many. It's used here because it puts a large series like all OpenRouter tokens and a small one like a single model on the same scale. To keep it comparable with GIFT-Eval and fev-bench, it's reported the way they do it. For each series, a model's average MASE over the 12 weeks is divided by seasonal naive's, so seasonal naive is 1 and lower is better. When a level has several series, those ratios are combined with a geometric mean. Earlier API requests were also rerun to check that the numbers reproduce. 12 of the original 17 API models returned identical forecasts, and the rest differed by less than 0.2%, which didn't change any ordering.
Day by day and week by week
The middle horizons are where foundation models look strongest. On daily data every foundation model beat seasonal naive on individual LLMs at both horizons, and over 7 days every one also beat AutoARIMA. At 1 week ahead on all tokens, 17 of the 21 beat seasonal naive. A likely reason is that these series are short and change fast. A model that has already seen thousands of other series can pick up a new LLM's ramp and its weekday pattern from a few weeks of history, while a statistical model fit on that history alone has little to go on. Further out the edge fades. At 4 weeks ahead on individual LLMs, none of the foundation models beat seasonal naive.
Actual vs backtest forecasts, all OpenRouter tokens, 1 day, 7 days, 1 week and 4 weeks ahead
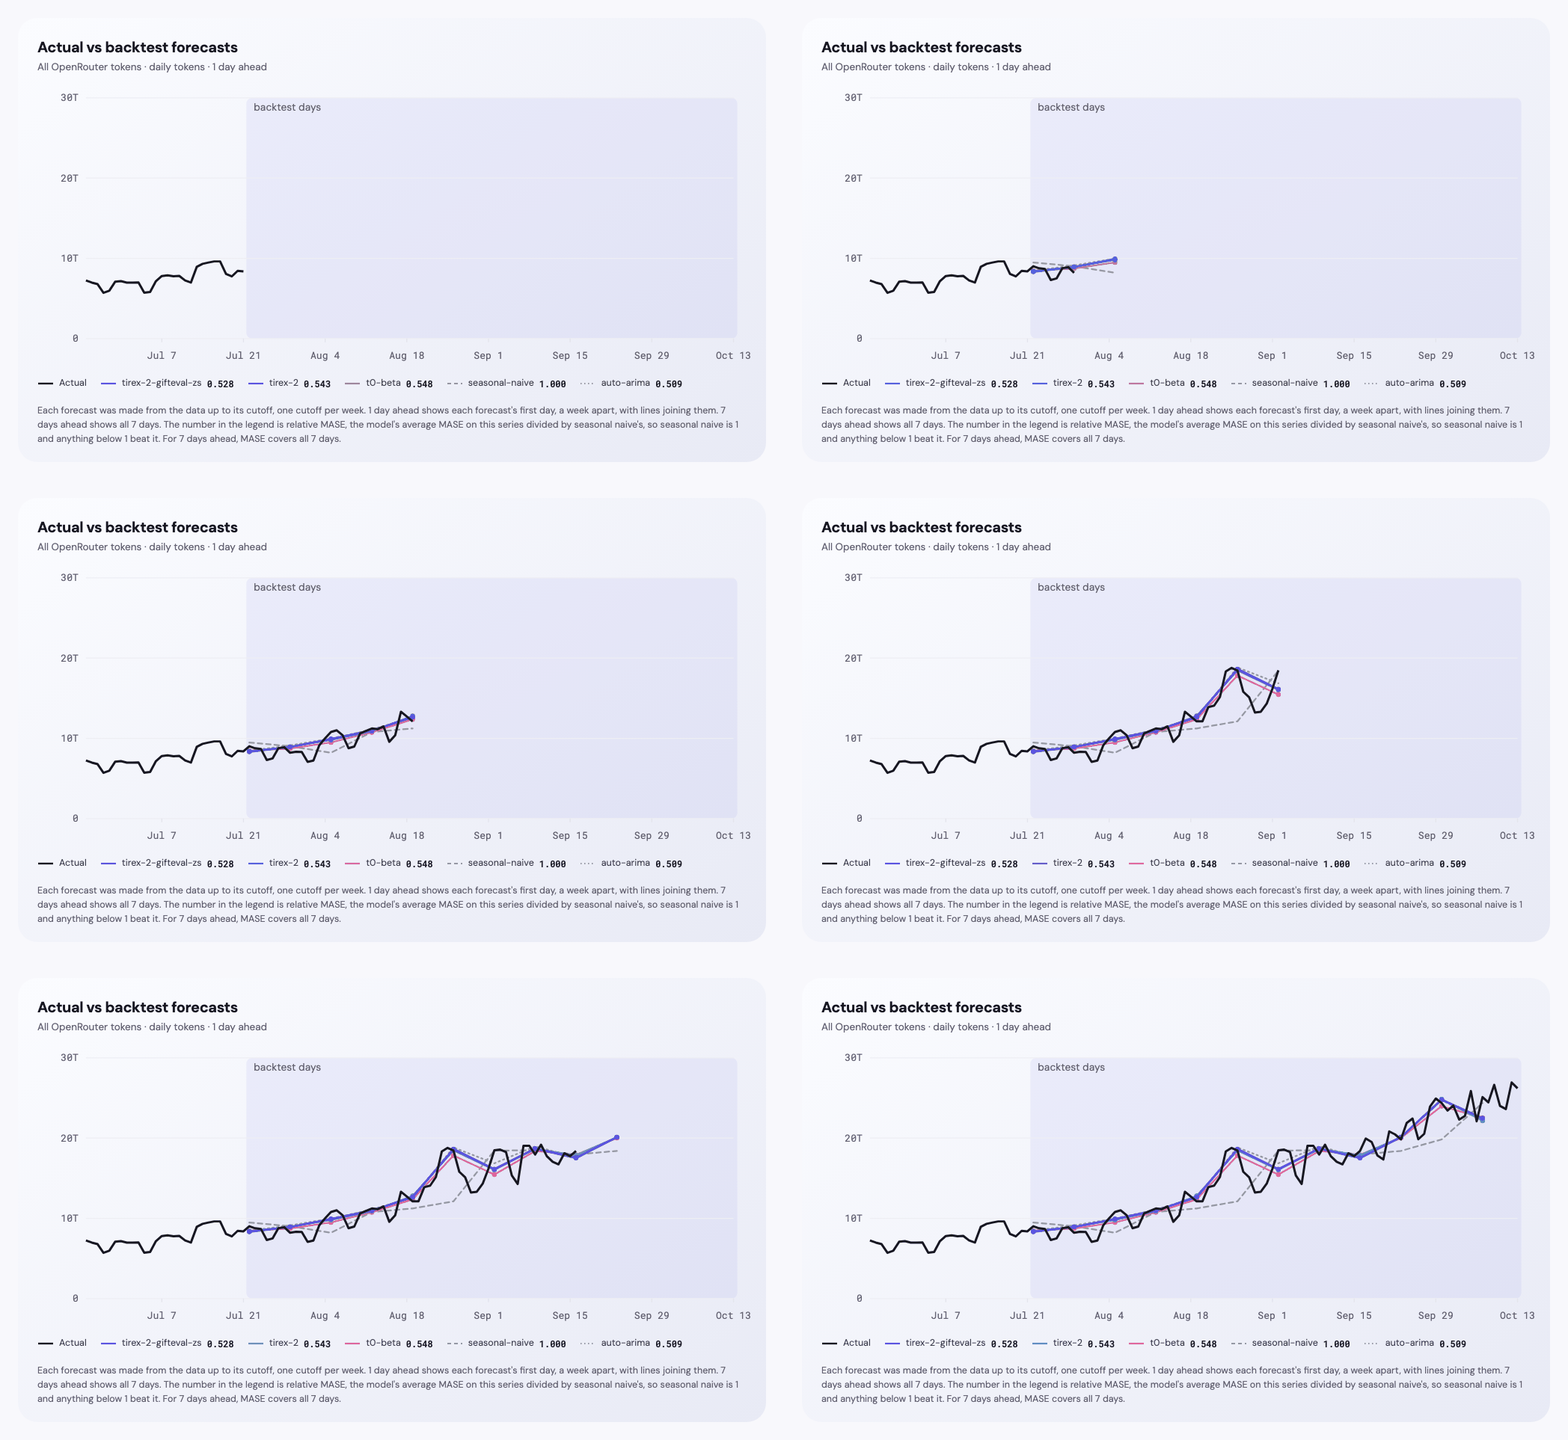
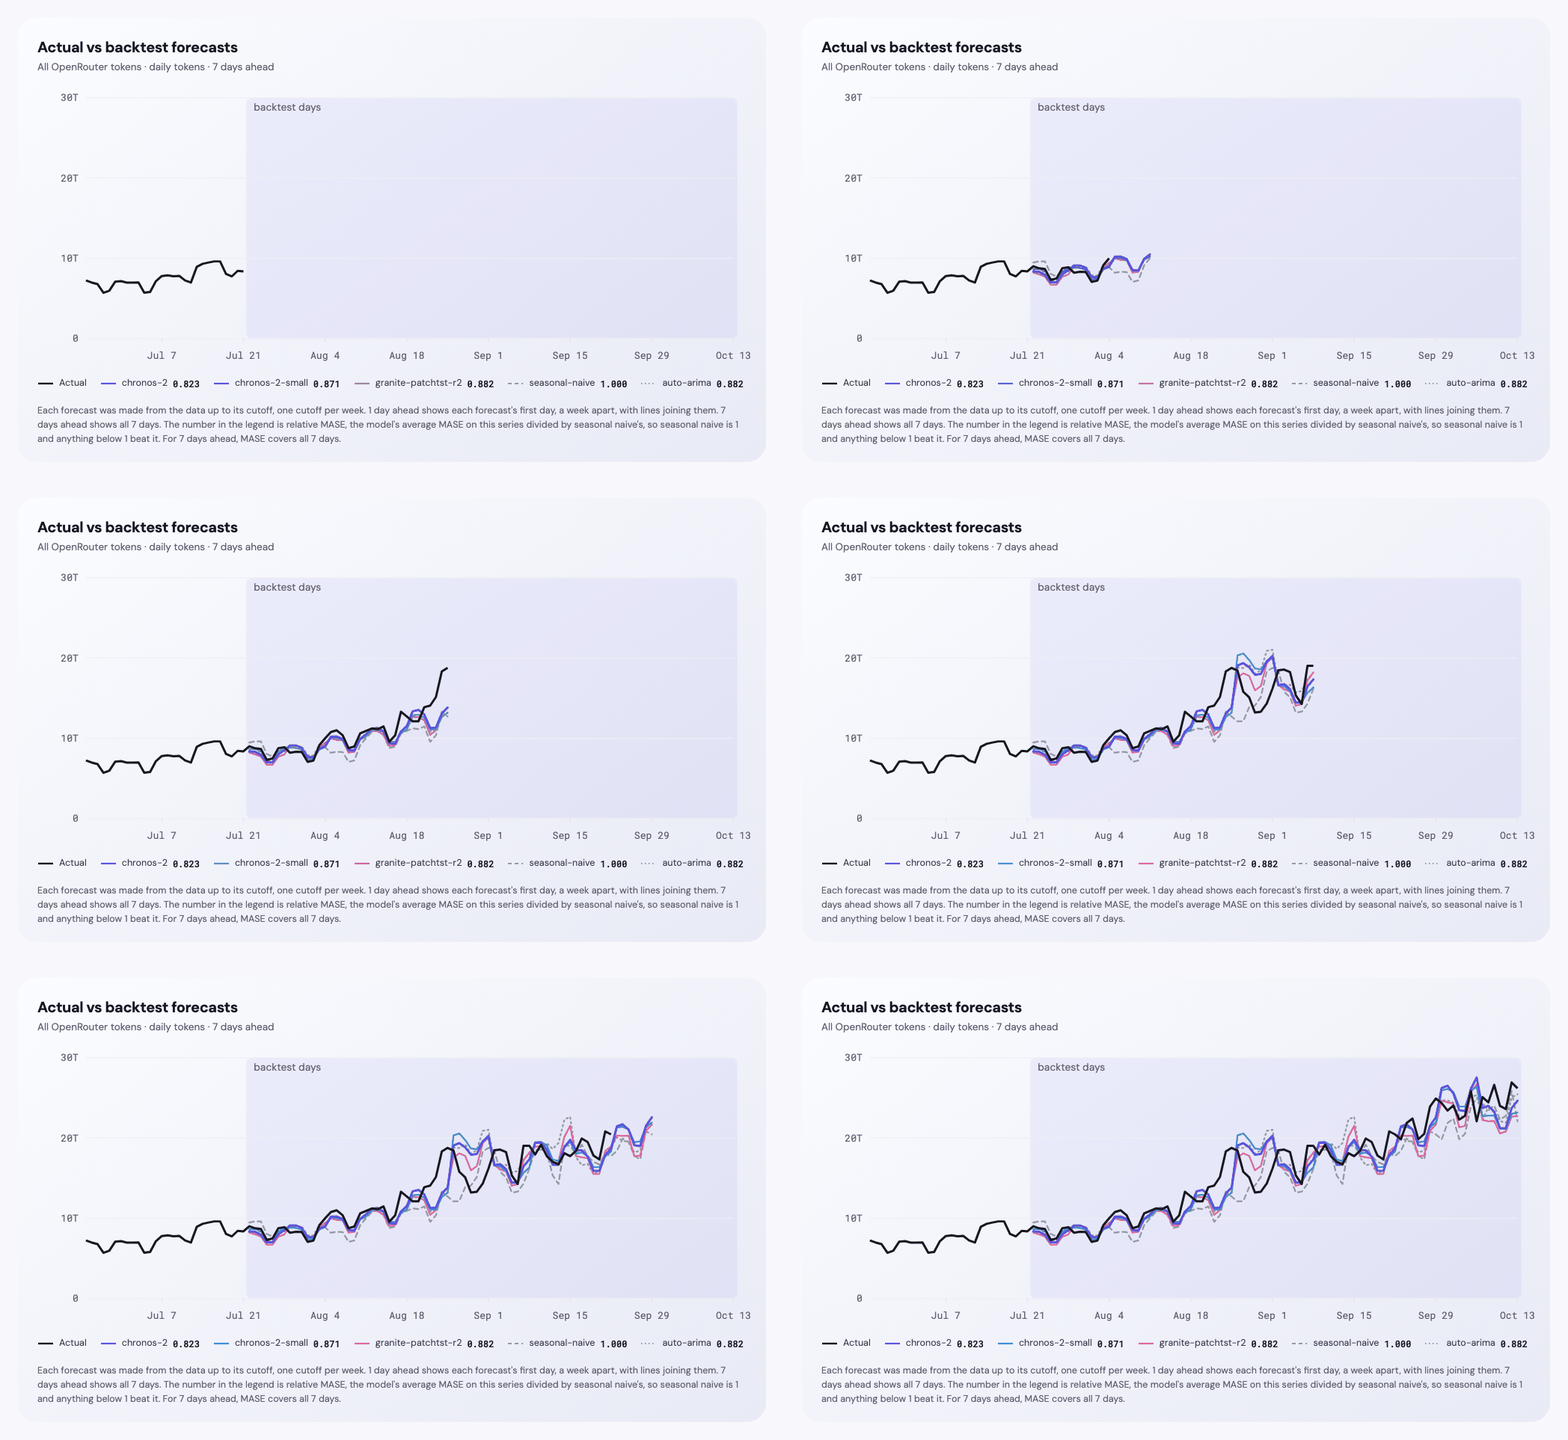
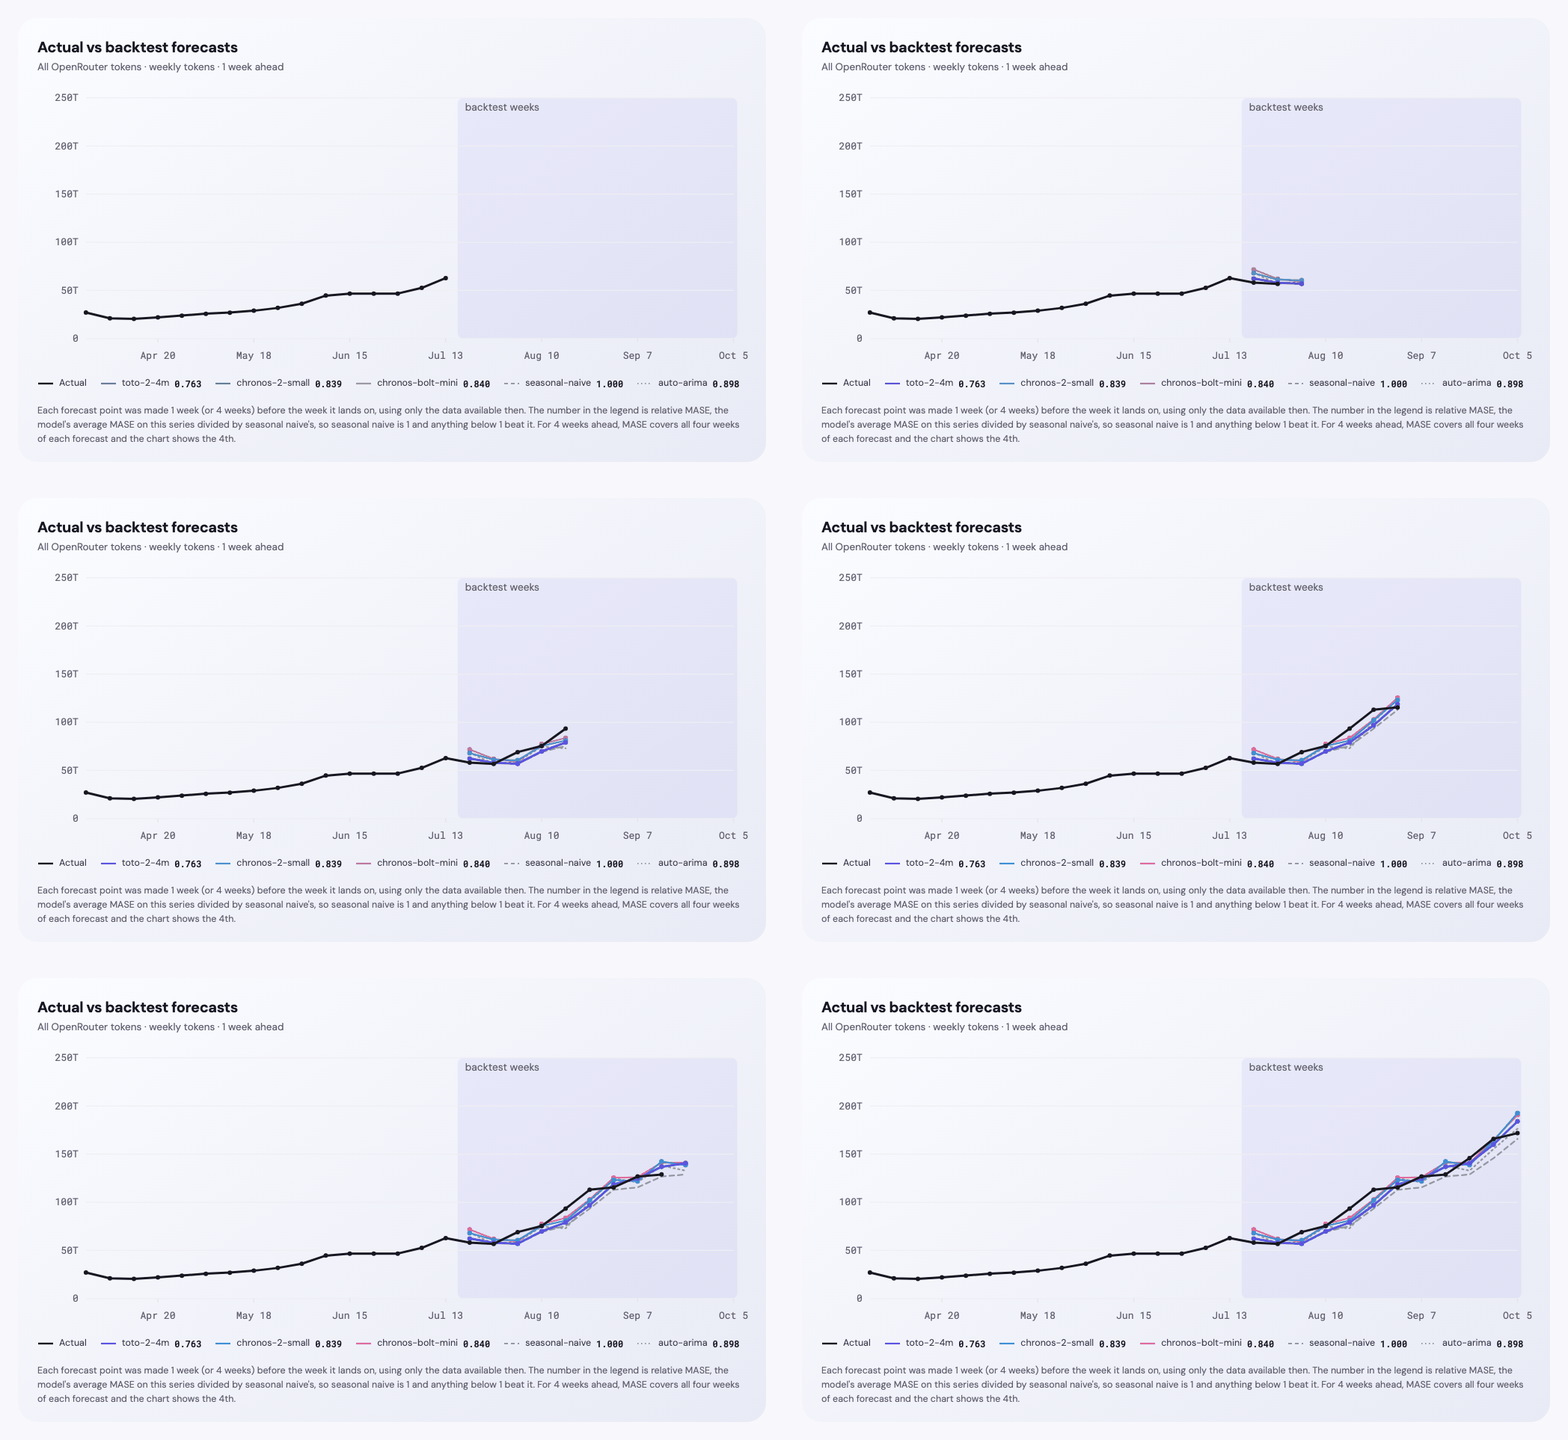
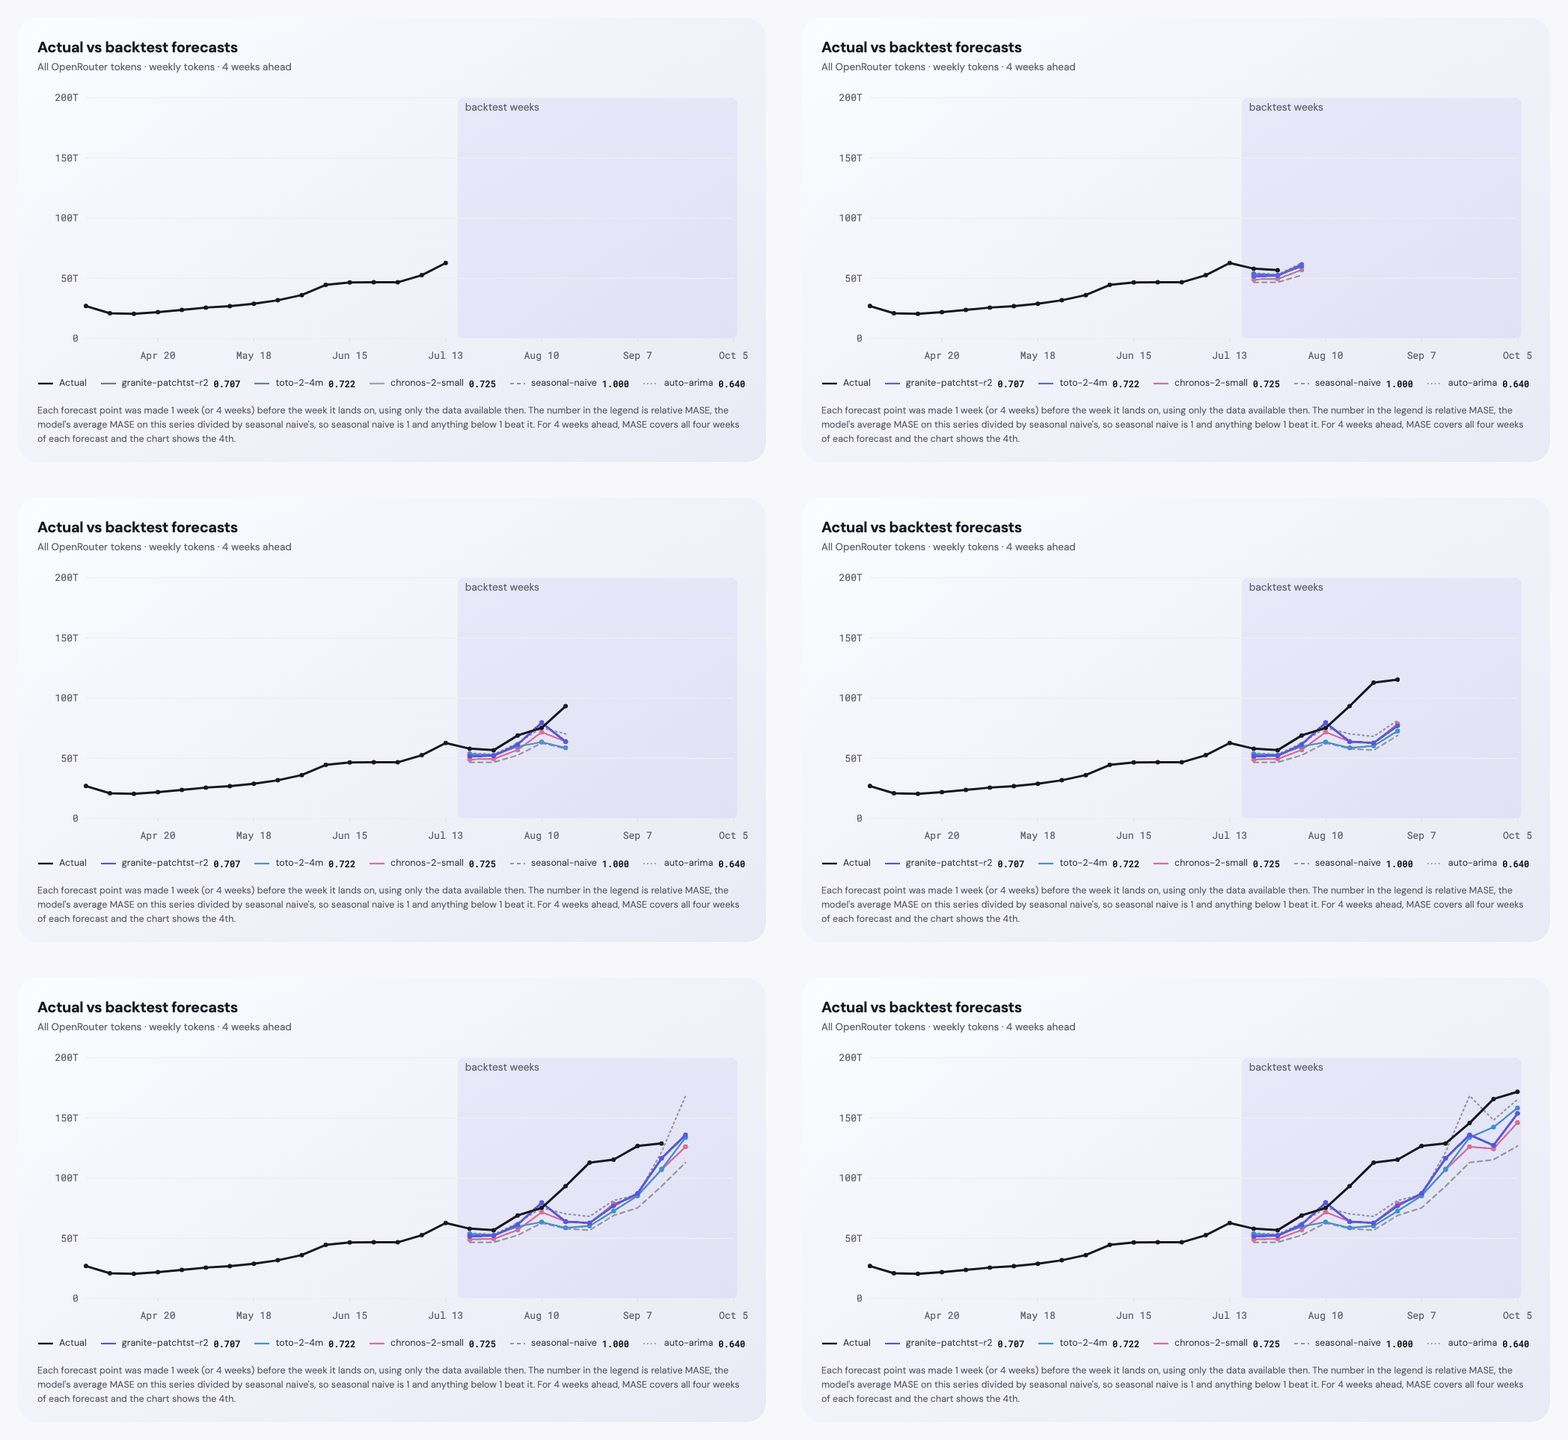
These animations play through the 12 backtest weeks for all OpenRouter tokens. Each one shows the three forecasters with the lowest MASE plus both baselines, next to the actual tokens, at 1 day, 7 days, 1 week and 4 weeks ahead.
Your data is your context
Context is Key [12] makes a related point from another direction. Its benchmark pairs each series with the background knowledge a human forecaster would use, and the forecasts that use that context come out ahead. The lesson carries over to practice. Every business has its own context, so choosing the right data to test on matters as much as choosing the model.
It's also a reason to test models the leaderboards don't highlight. Chronos-2 Small and Chronos-Bolt Mini aren't on GIFT-Eval or fev-bench at all, yet Chronos-2 Small has the lowest error on individual LLMs at 1 week ahead and Chronos-Bolt Mini has the lowest on categories at 4 weeks. Granite PatchTST isn't on fev-bench, and it's 1st on daily individual LLMs over 7 days. A shortlist built only from the top of a leaderboard would miss most of them.
GIFT-Eval and fev-bench leaders don't match this experiment
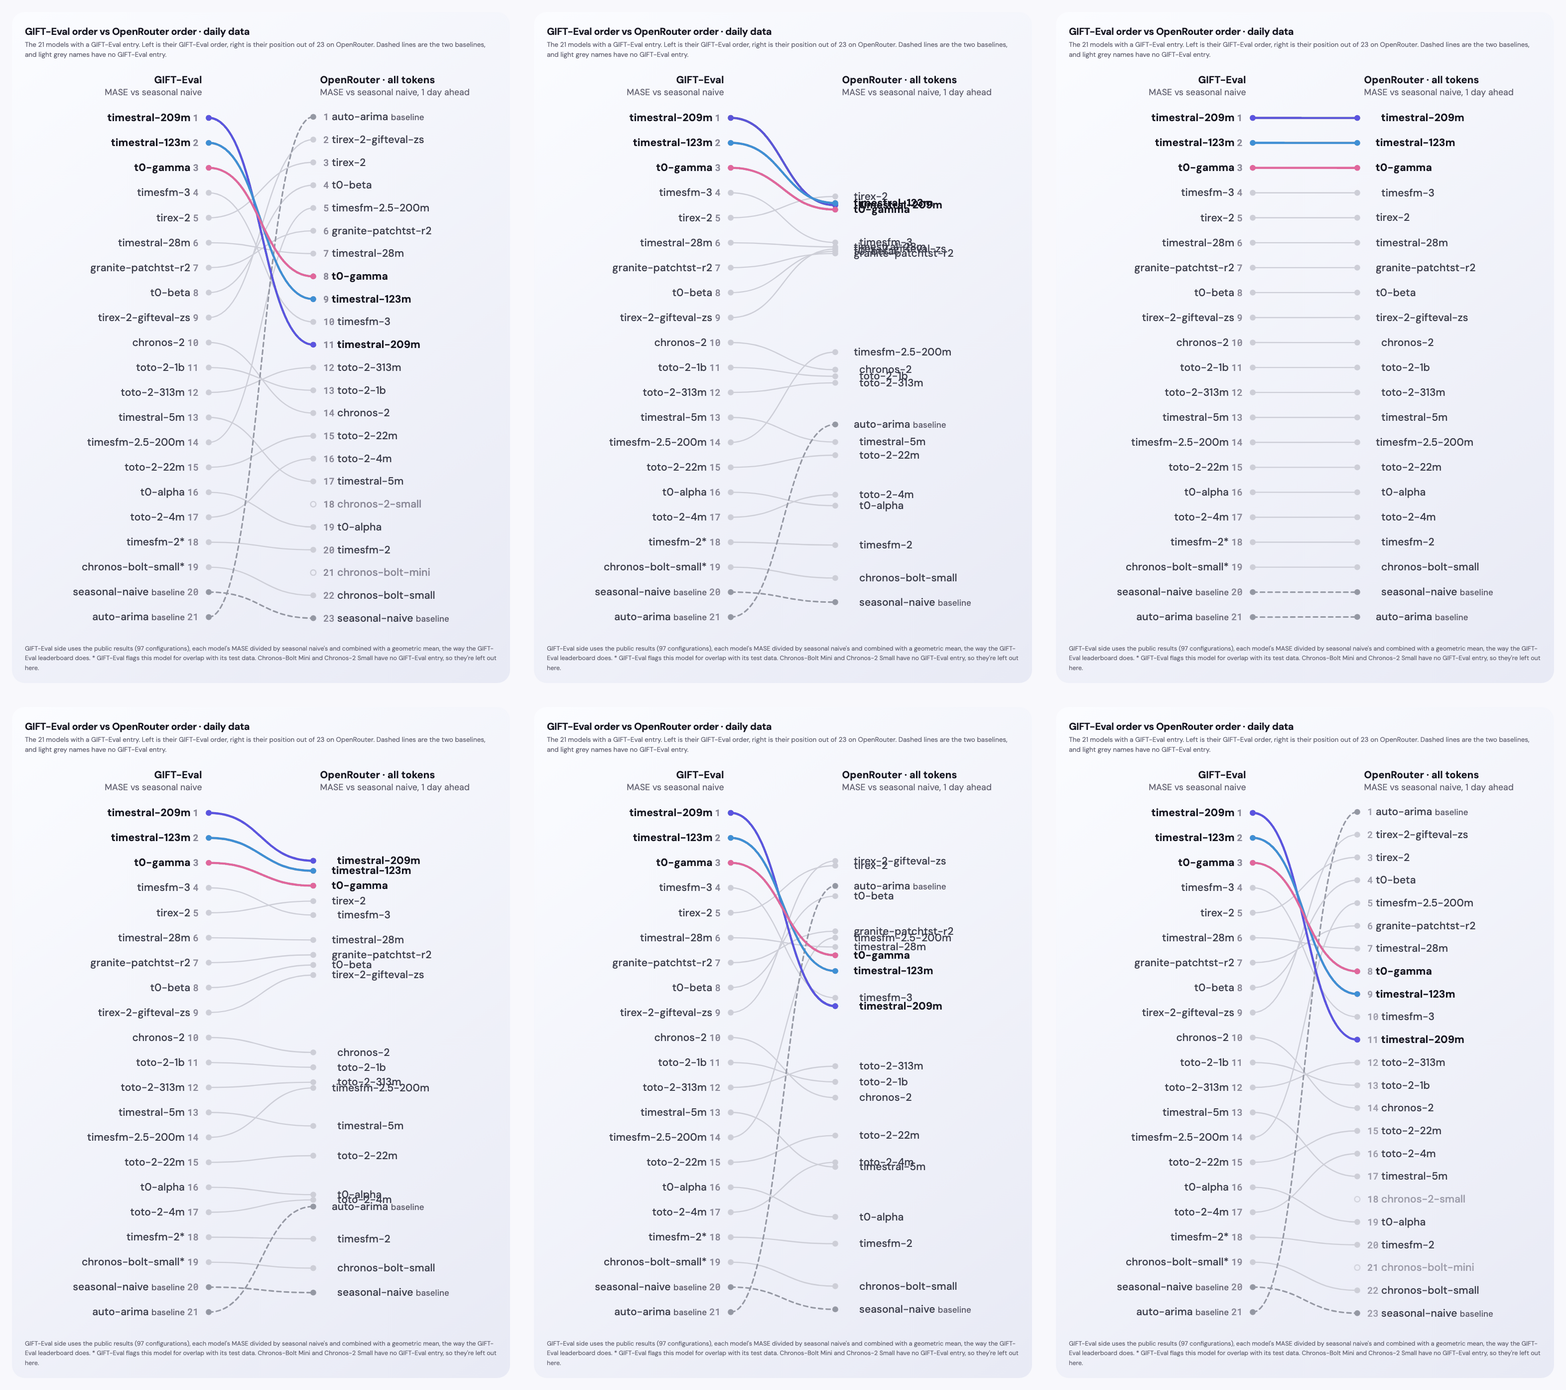
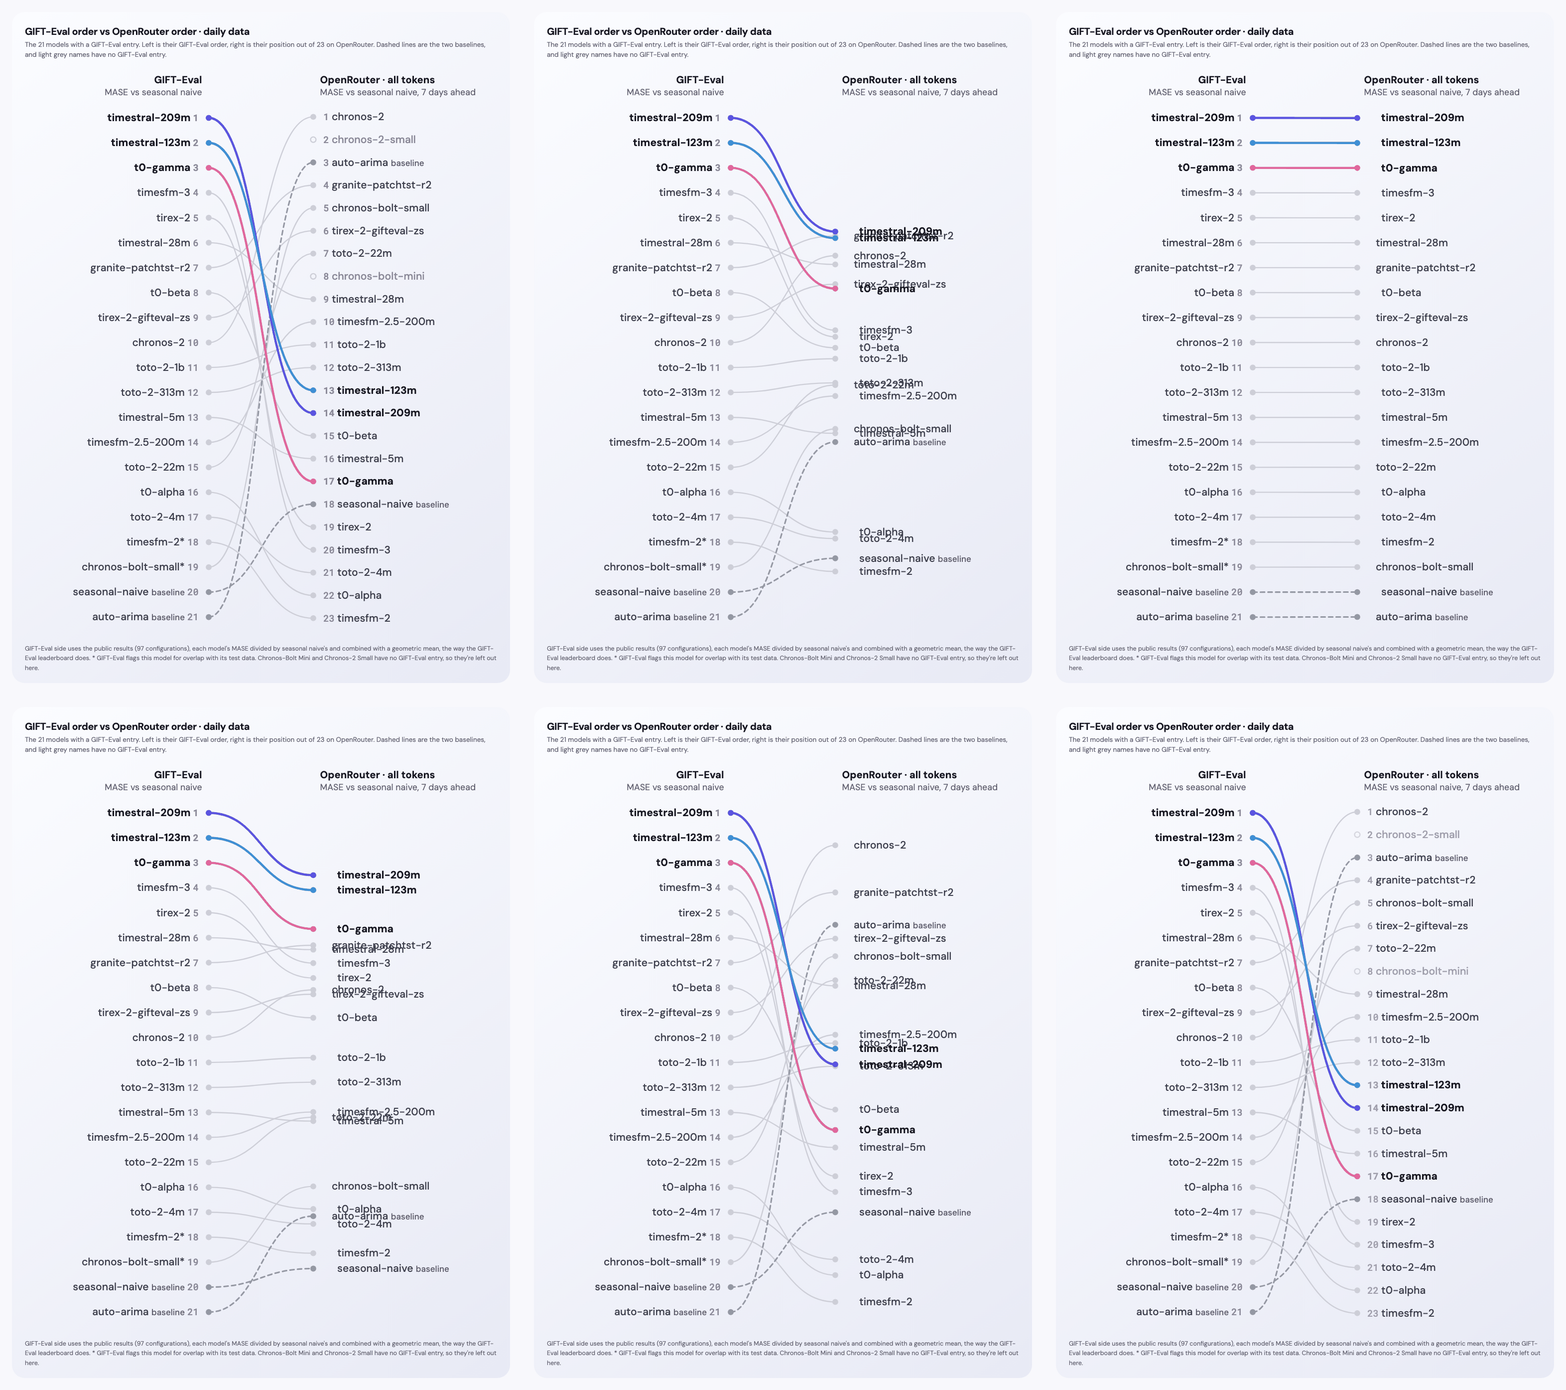
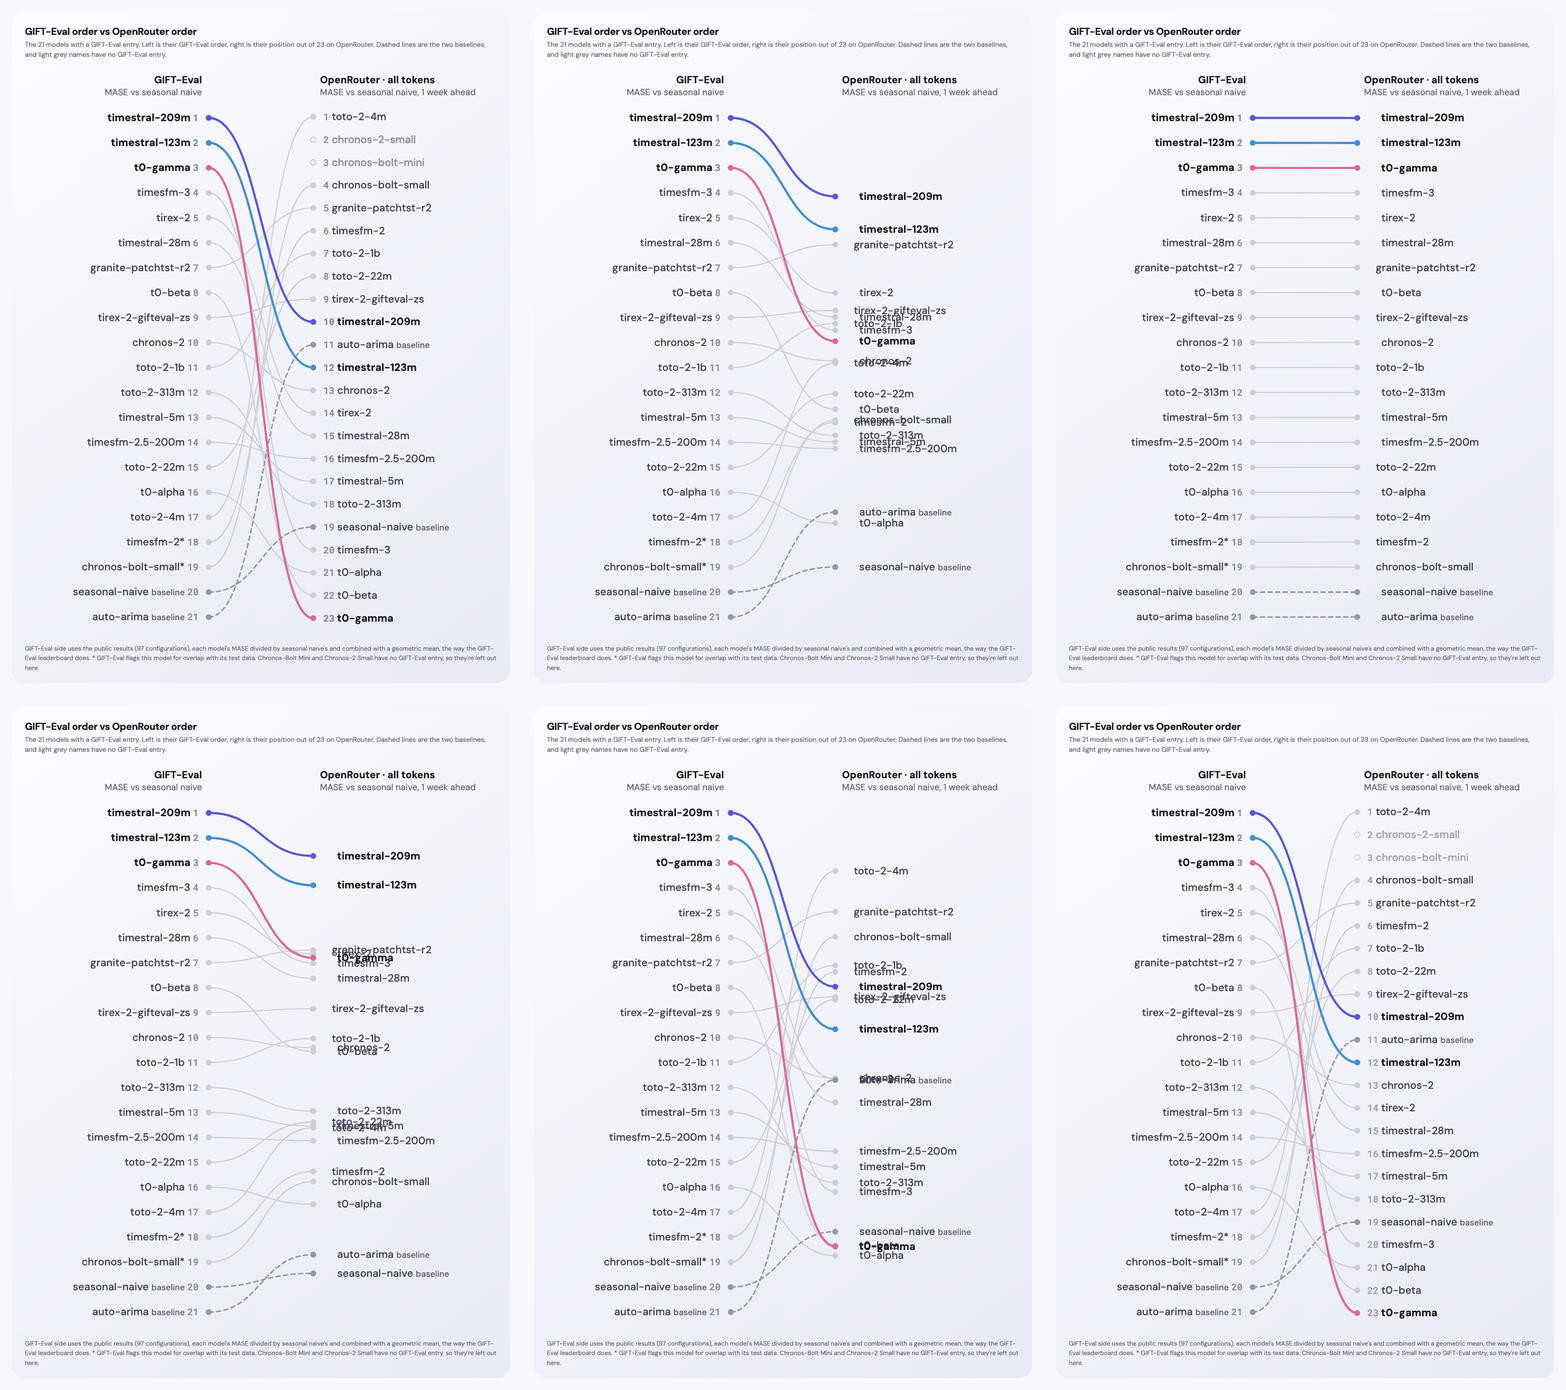
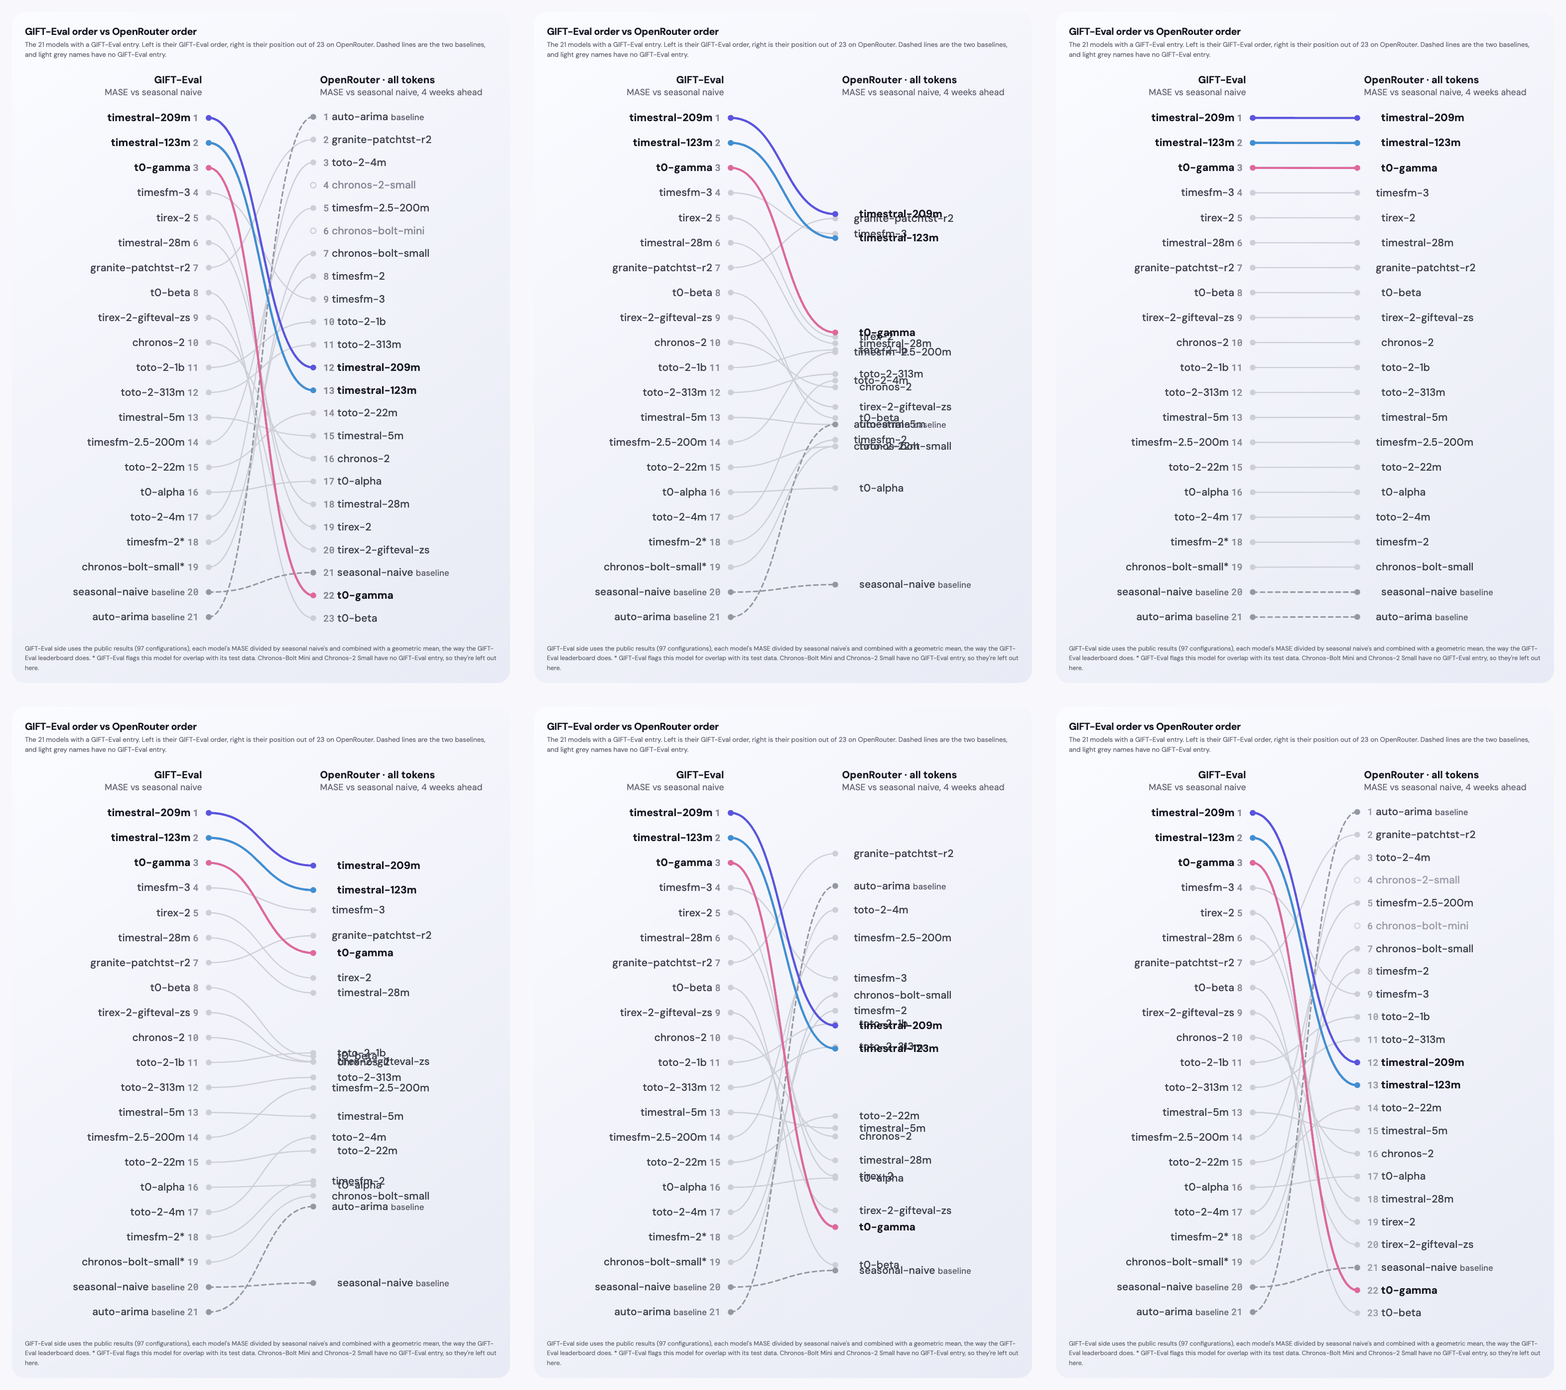
Comparing these results with GIFT-Eval [4] and fev-bench [5] is where it gets interesting, because the rankings don't hold up. In each chart below, the left column is a model's position on the benchmark and the right column is its position out of 23 on all OpenRouter tokens, at 1 day, 7 days, 1 week and 4 weeks ahead. If the benchmark order carried over, the lines would run straight across. The animations start from that picture and move each model to where it actually finished. Dashed lines are the two baselines, and light grey names have no benchmark entry.
GIFT-Eval order vs OpenRouter order, all OpenRouter tokens, 1 day, 7 days, 1 week and 4 weeks ahead
fev-bench order vs OpenRouter order, all OpenRouter tokens, 1 day, 7 days, 1 week and 4 weeks ahead
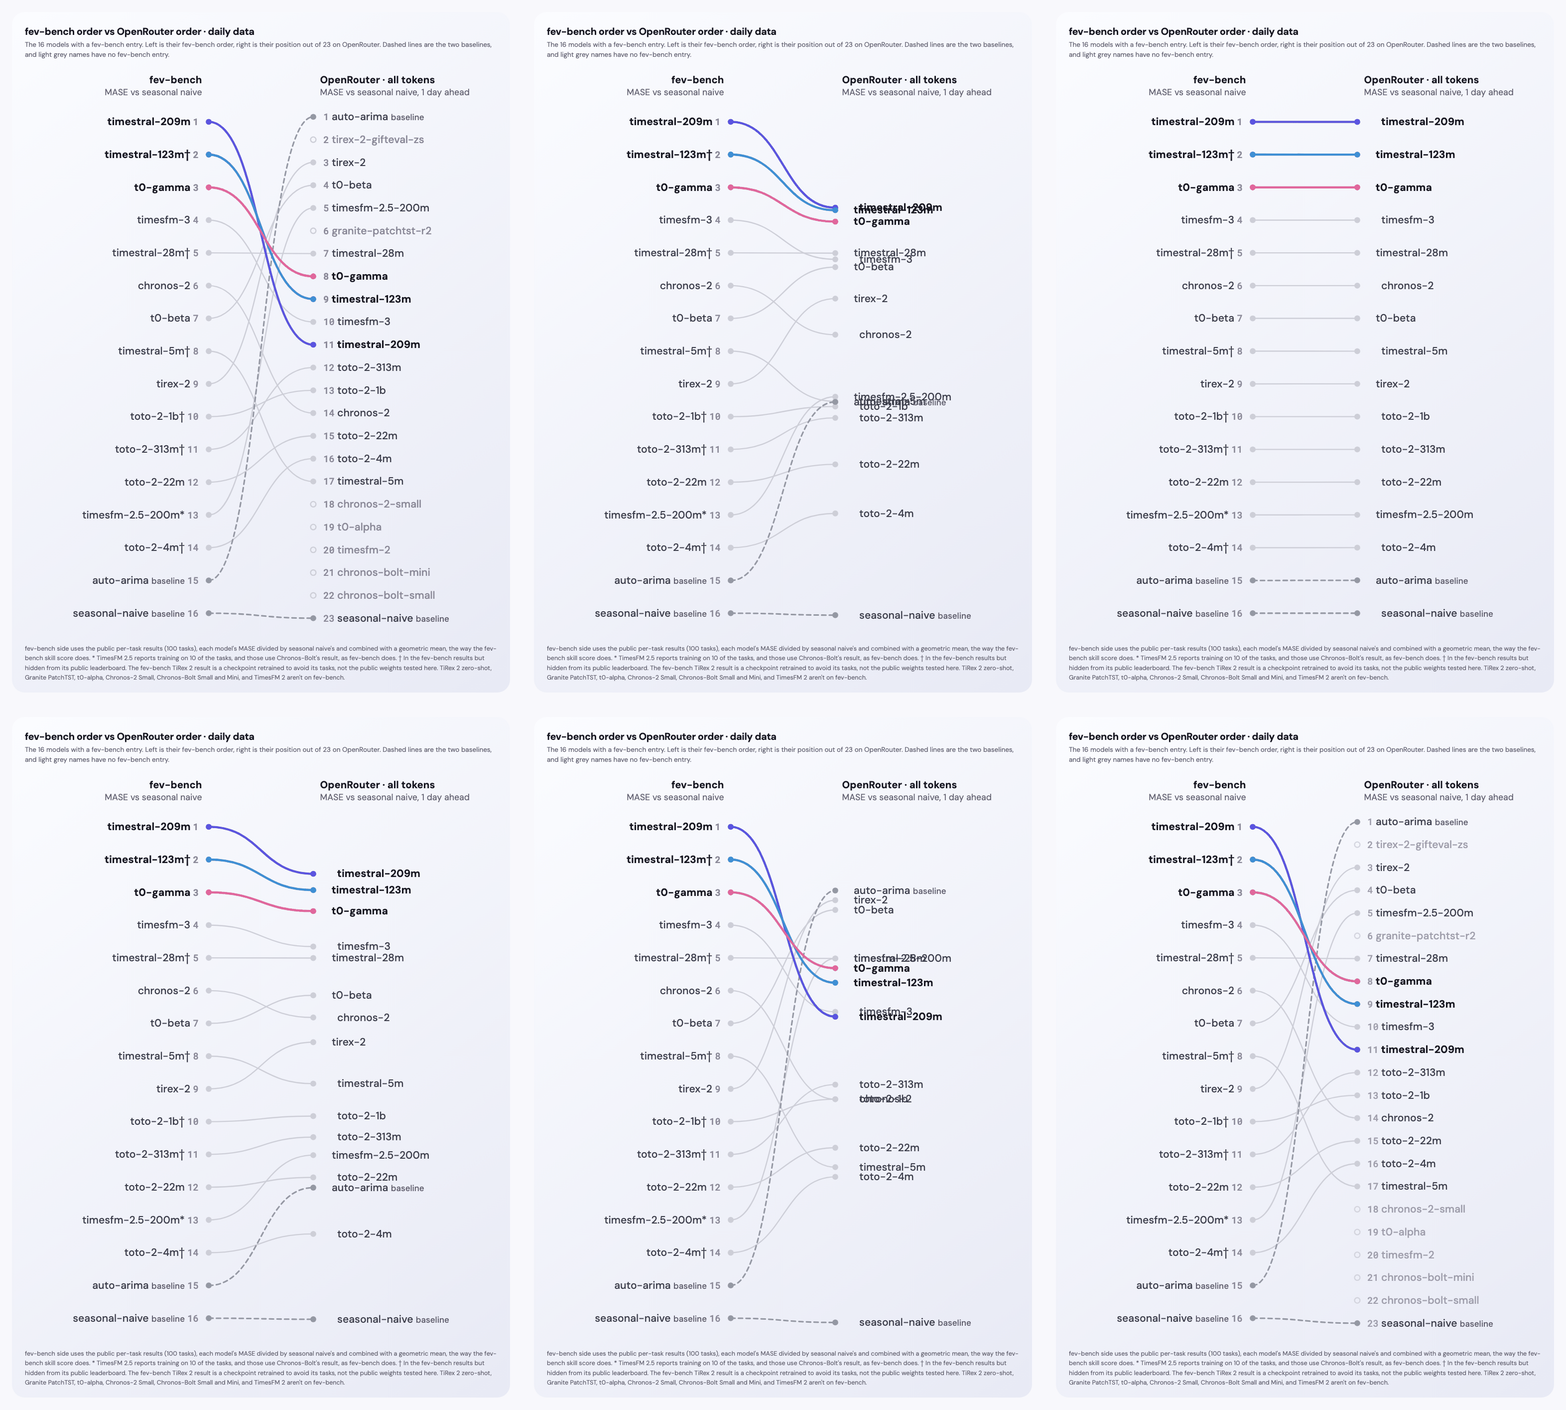
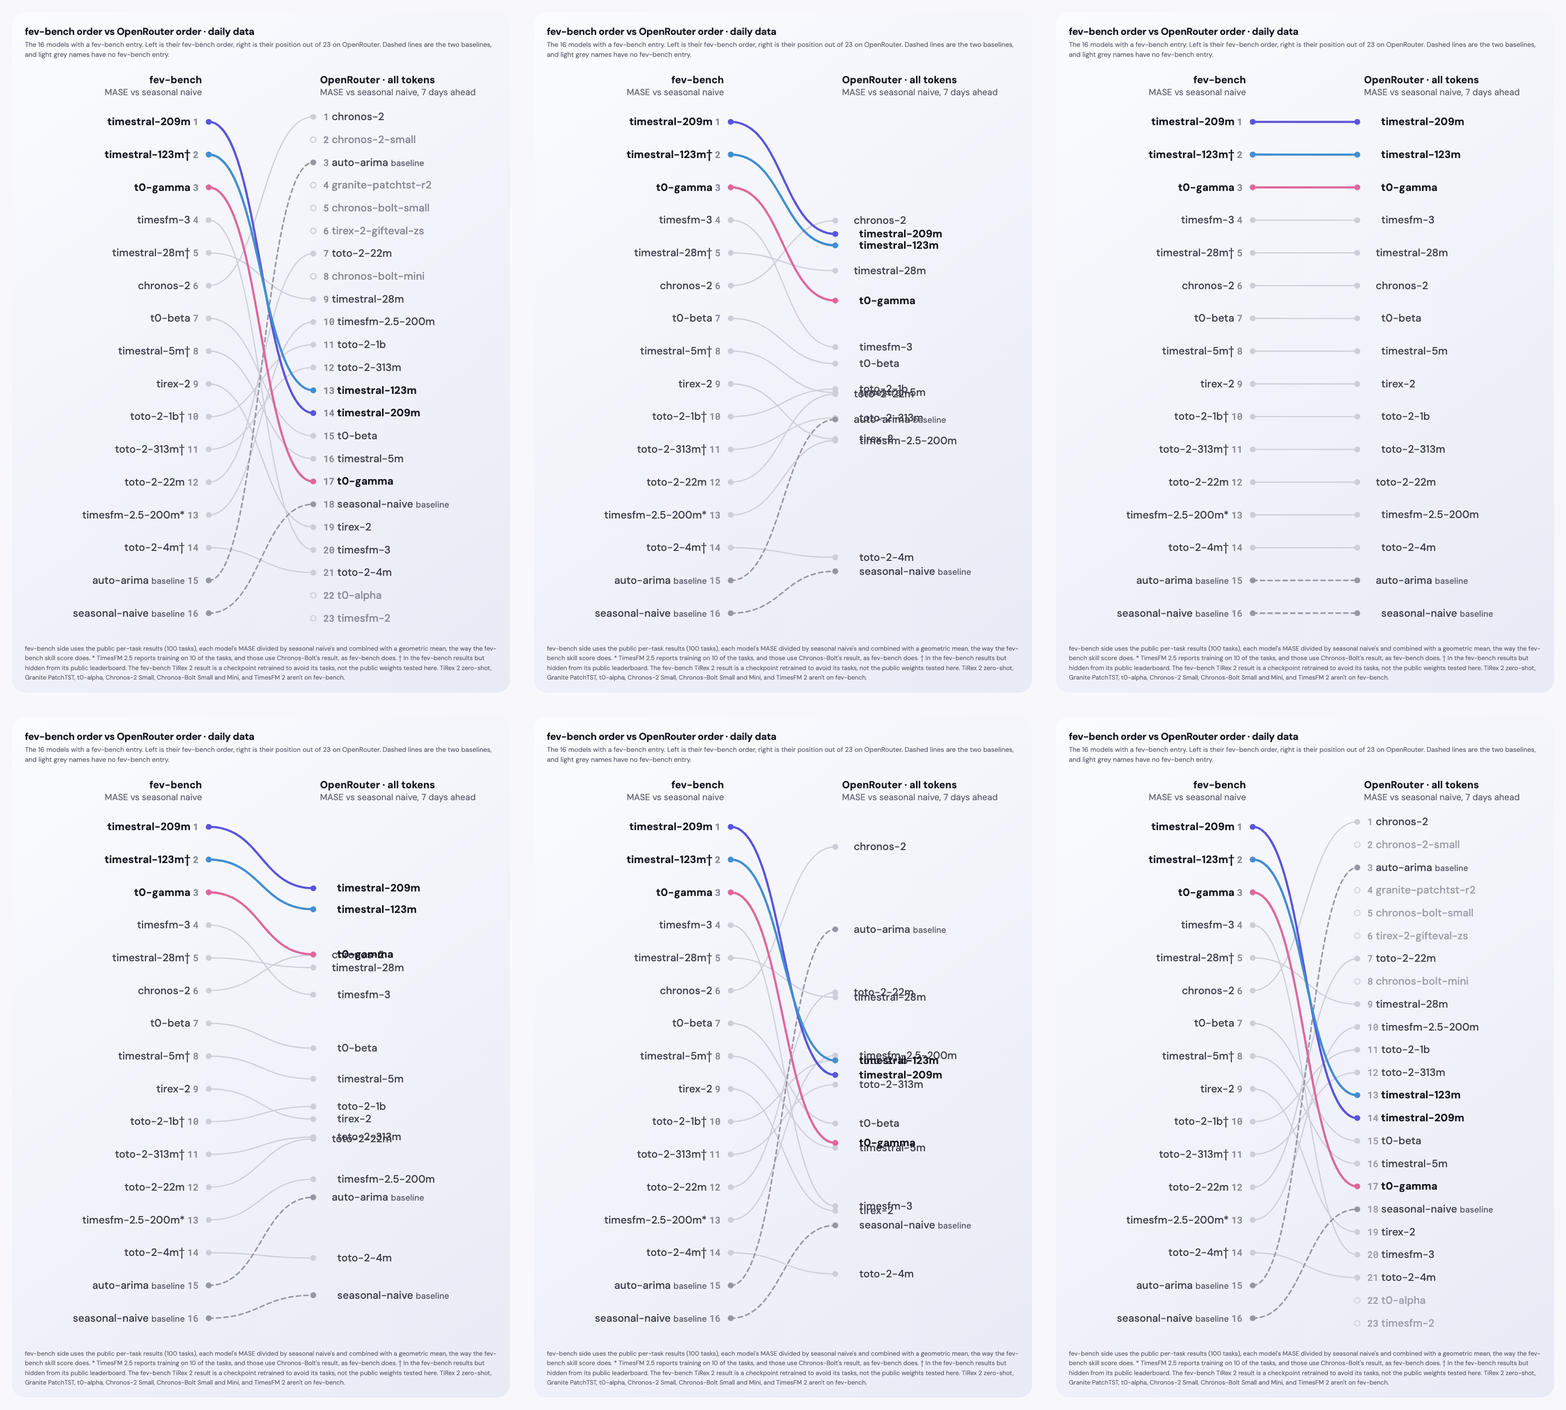
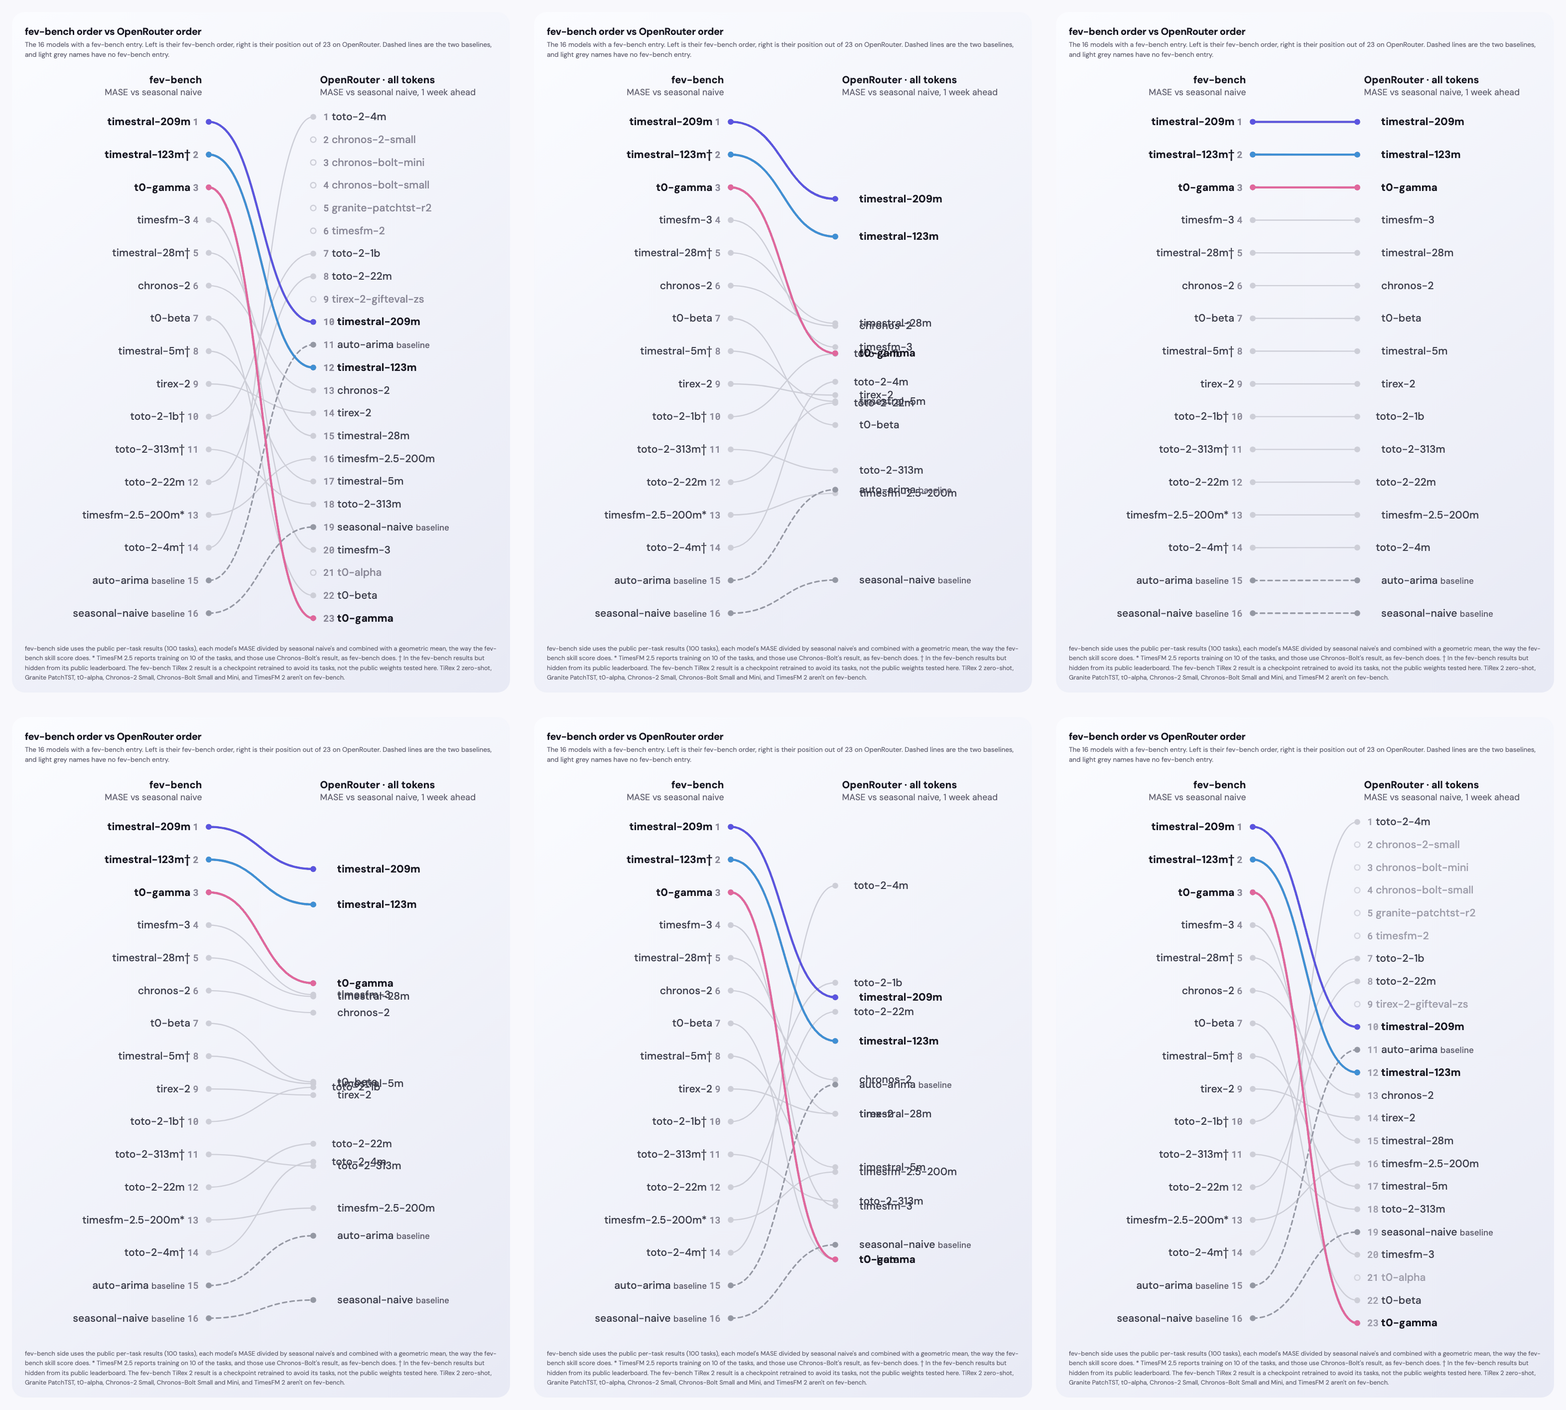
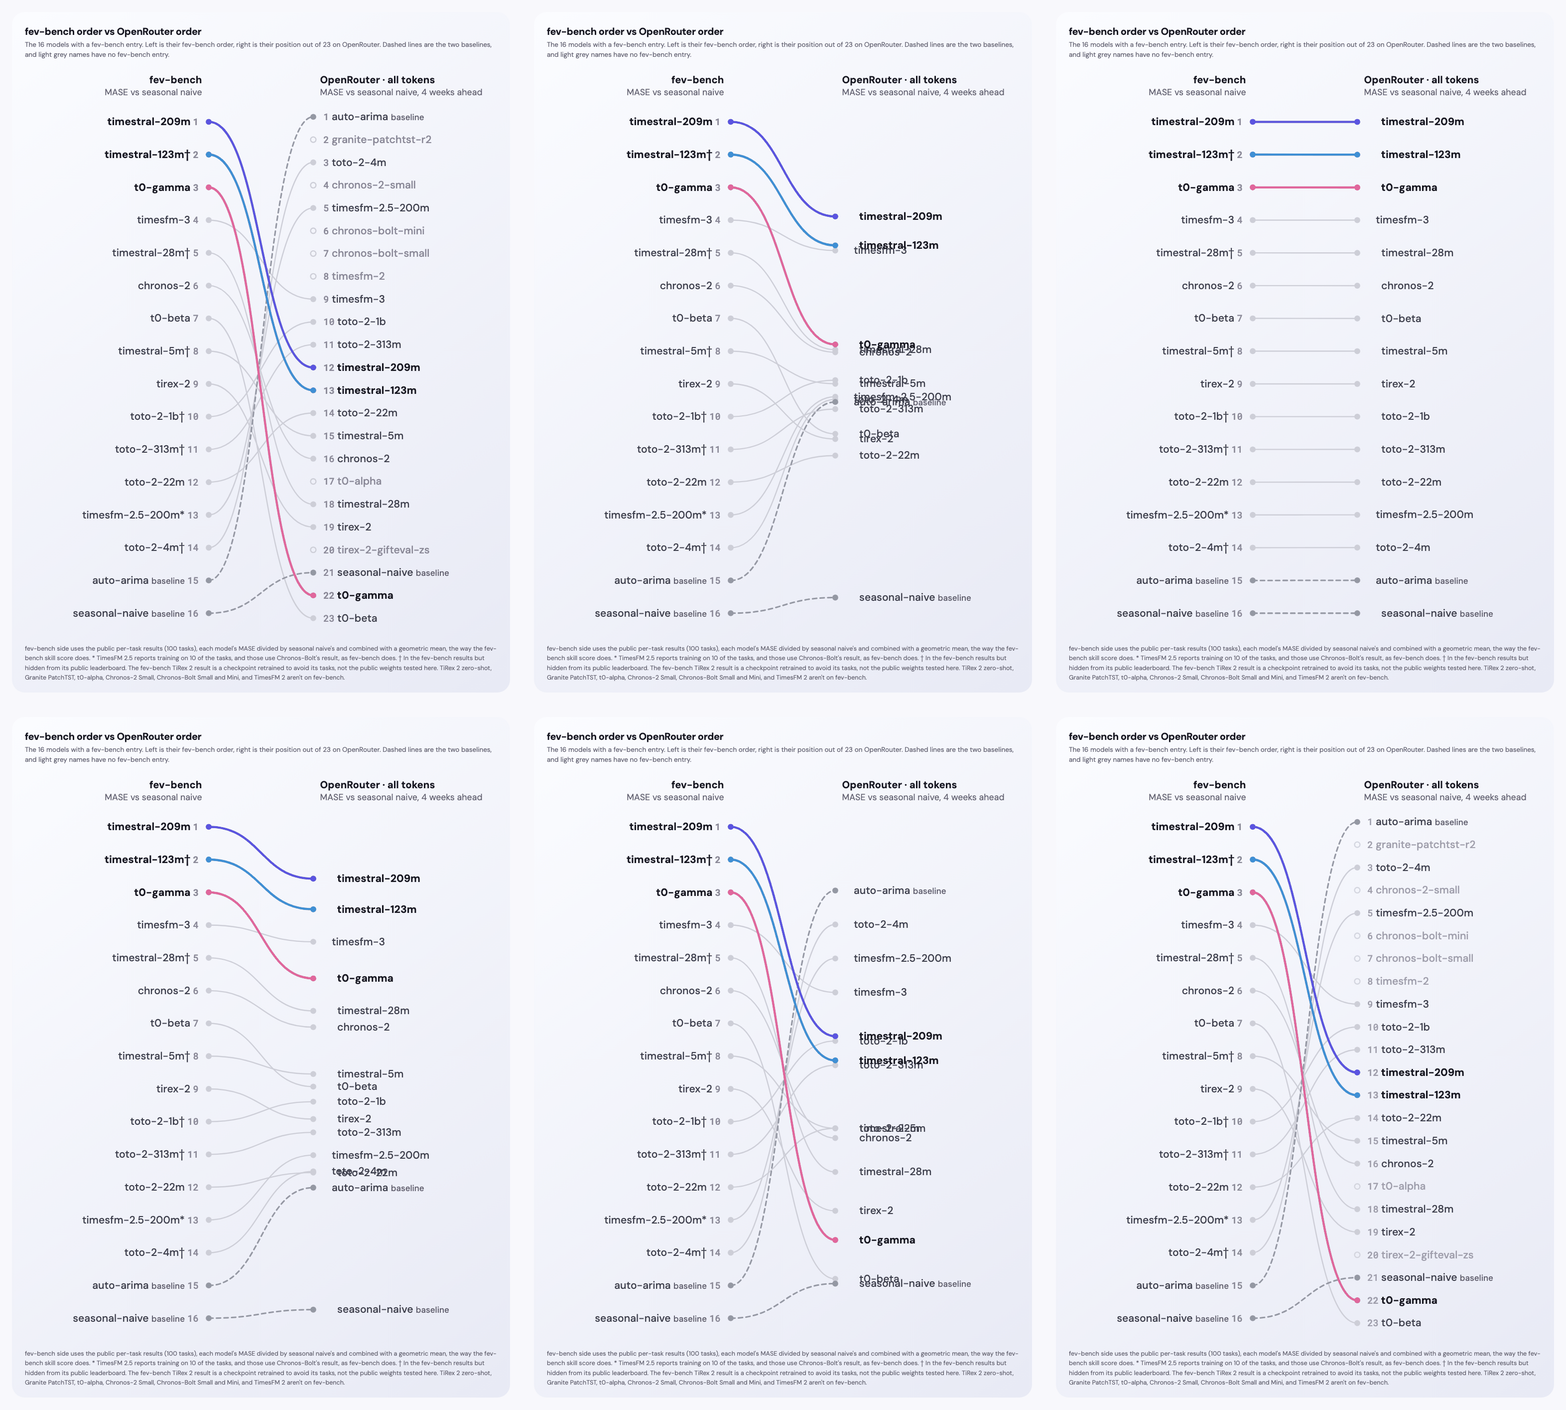
The leaders changed while this test was being written up. A week ago TimesFM 3 was first on both leaderboards. Now Mistral's Timestral 209M is first on both, followed by Timestral 123M and The Forecasting Company's t0-gamma, and TimesFM 3 is 4th. Neither the old leader nor the new ones carry over. On all OpenRouter tokens Timestral 209M finishes 11th at 1 day, 14th at 7 days, 10th at 1 week and 12th at 4 weeks. t0-gamma finishes 8th, 17th, 23rd and 22nd, so it's last at 1 week. TimesFM 3 finishes 10th, 20th, 20th and 9th. Across the 33 LLMs in the animation at the top, neither Timestral 209M nor TimesFM 3 is the best forecaster on any of them. The winners on all tokens are AutoARIMA at 1 day, Chronos-2 at 7 days, Toto 4M at 1 week and AutoARIMA again at 4 weeks.
GIFT-Eval also publishes leaderboards by domain and by frequency [4], so it's worth checking whether a narrower view would have done better. The closest domain to this data is Web/CloudOps, and Timestral 123M is first there. On the daily and weekly views, which match this data's frequency, t0-gamma is first. Neither pick does well here. Timestral 123M finishes 9th, 13th, 12th and 13th on all tokens, and t0-gamma is last at 1 week. Meanwhile some models do better on OpenRouter than their spot on any view suggests. Chronos-2 is 5th on GIFT-Eval's weekly view, and on OpenRouter it wins all tokens over 7 days and categories at 1 week. Granite PatchTST is 6th on the daily view and 1st on OpenRouter's daily individual LLMs over 7 days. The narrower views don't match this data well either. GIFT-Eval's Web/CloudOps configurations are machine telemetry sampled every 10 seconds to every hour, its weekly view has only 8 configurations, and none of them are market demand like this.
None of this means the benchmarks are wrong. They average over many domains, and token usage is one domain with fast growth over this period. Hyndman's point about aggregate scores hiding variance on the series a business actually needs [1] is what that looks like in practice.
Where this goes next
Bridging research and day-to-day execution is what TimeCopilot and FoundationForecast are for, and testing more domains comes next. The early picture is encouraging and humbling at the same time. Foundation models did well at the horizons that matter most here, and seasonal naive still won some of the boards outright. Rankings also move over time, as the live Impermanent benchmark on GitHub activity shows [13], so a choice that's right today may need checking again next quarter.
It's also worth remembering what these models were working with. This is public data, with no fine-tuning, no curated features and only a few weeks of history for many LLMs. If they hold up this well here, it's worth asking what they can do on the carefully prepared data a company has for its own problem.
Interactive charts
Pick any of the 65 weekly series below, from all OpenRouter tokens down to a single LLM, to see its actual tokens next to the backtest forecasts from the three best forecasters and both baselines, 1 or 4 weeks ahead.
Actual vs backtest forecasts
Full scores (appendix)
Every forecaster's MASE relative to seasonal naive at each level, ordered from lowest to highest. Seasonal naive is 1, so anything below 1 beat it. The weekly boards come first (1 week ahead, then 4 weeks ahead), followed by the daily boards (1 day ahead, then 7 days ahead).
MASE vs seasonal naive by level, weekly and daily data
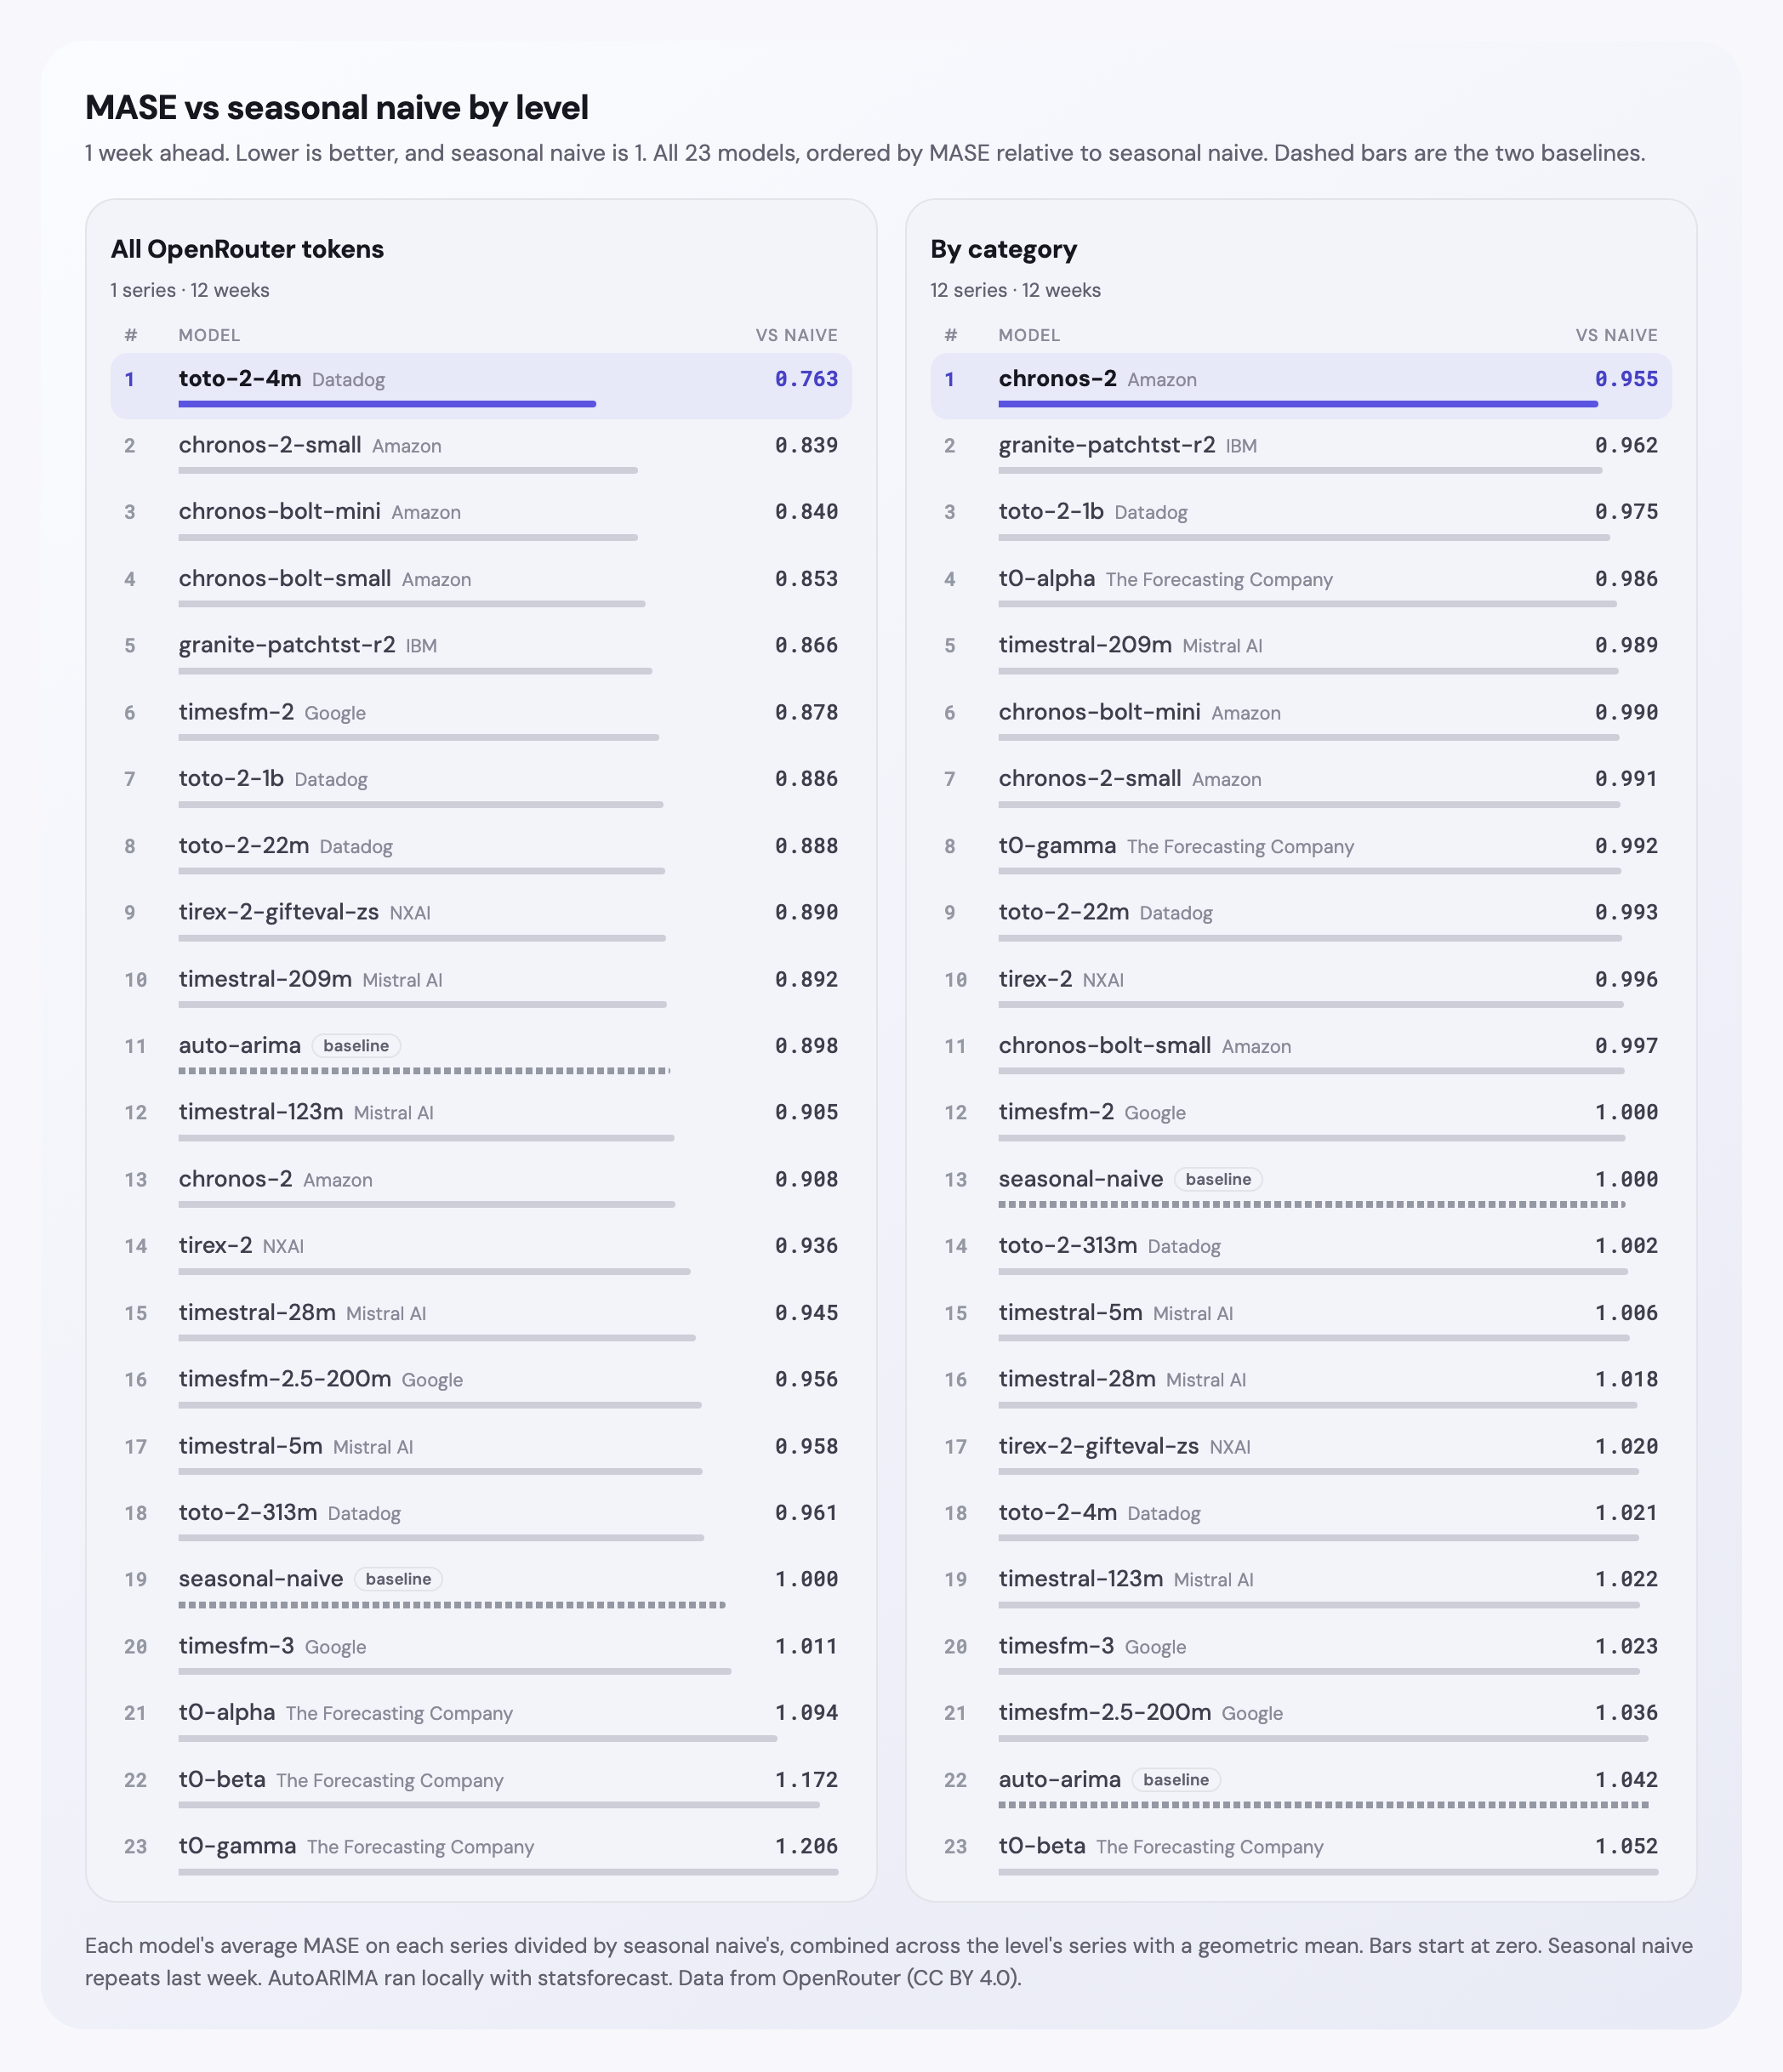
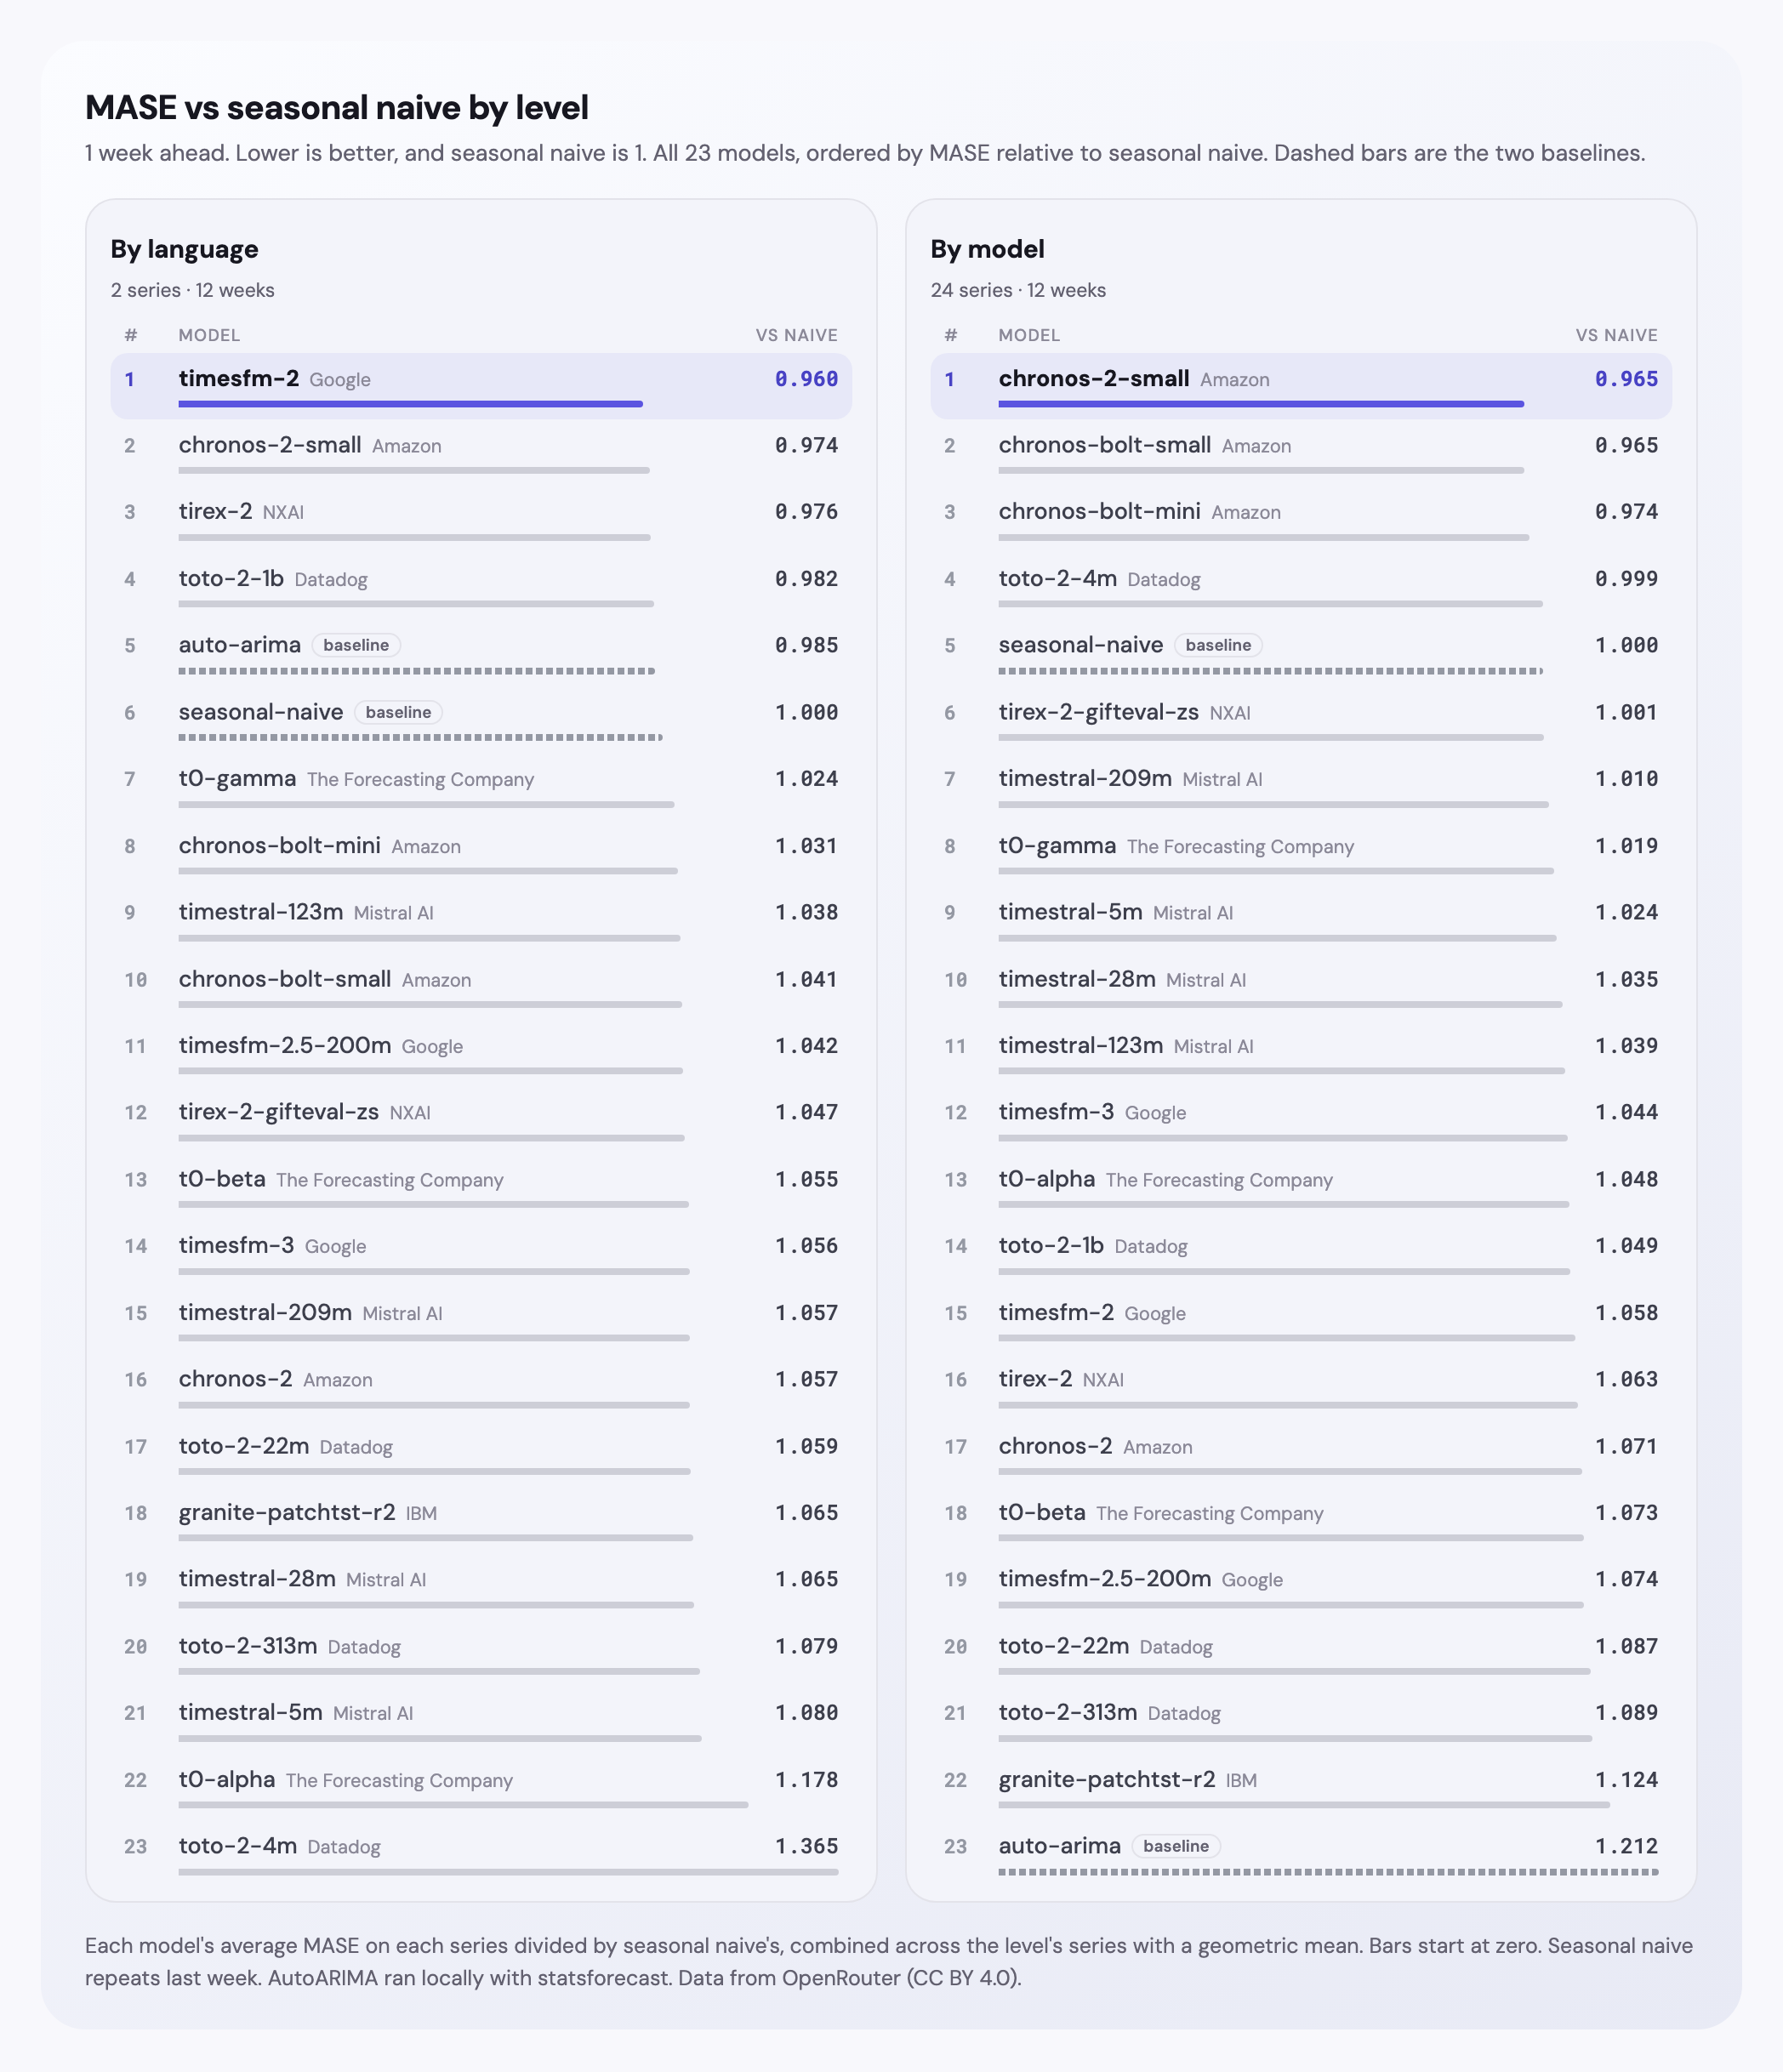
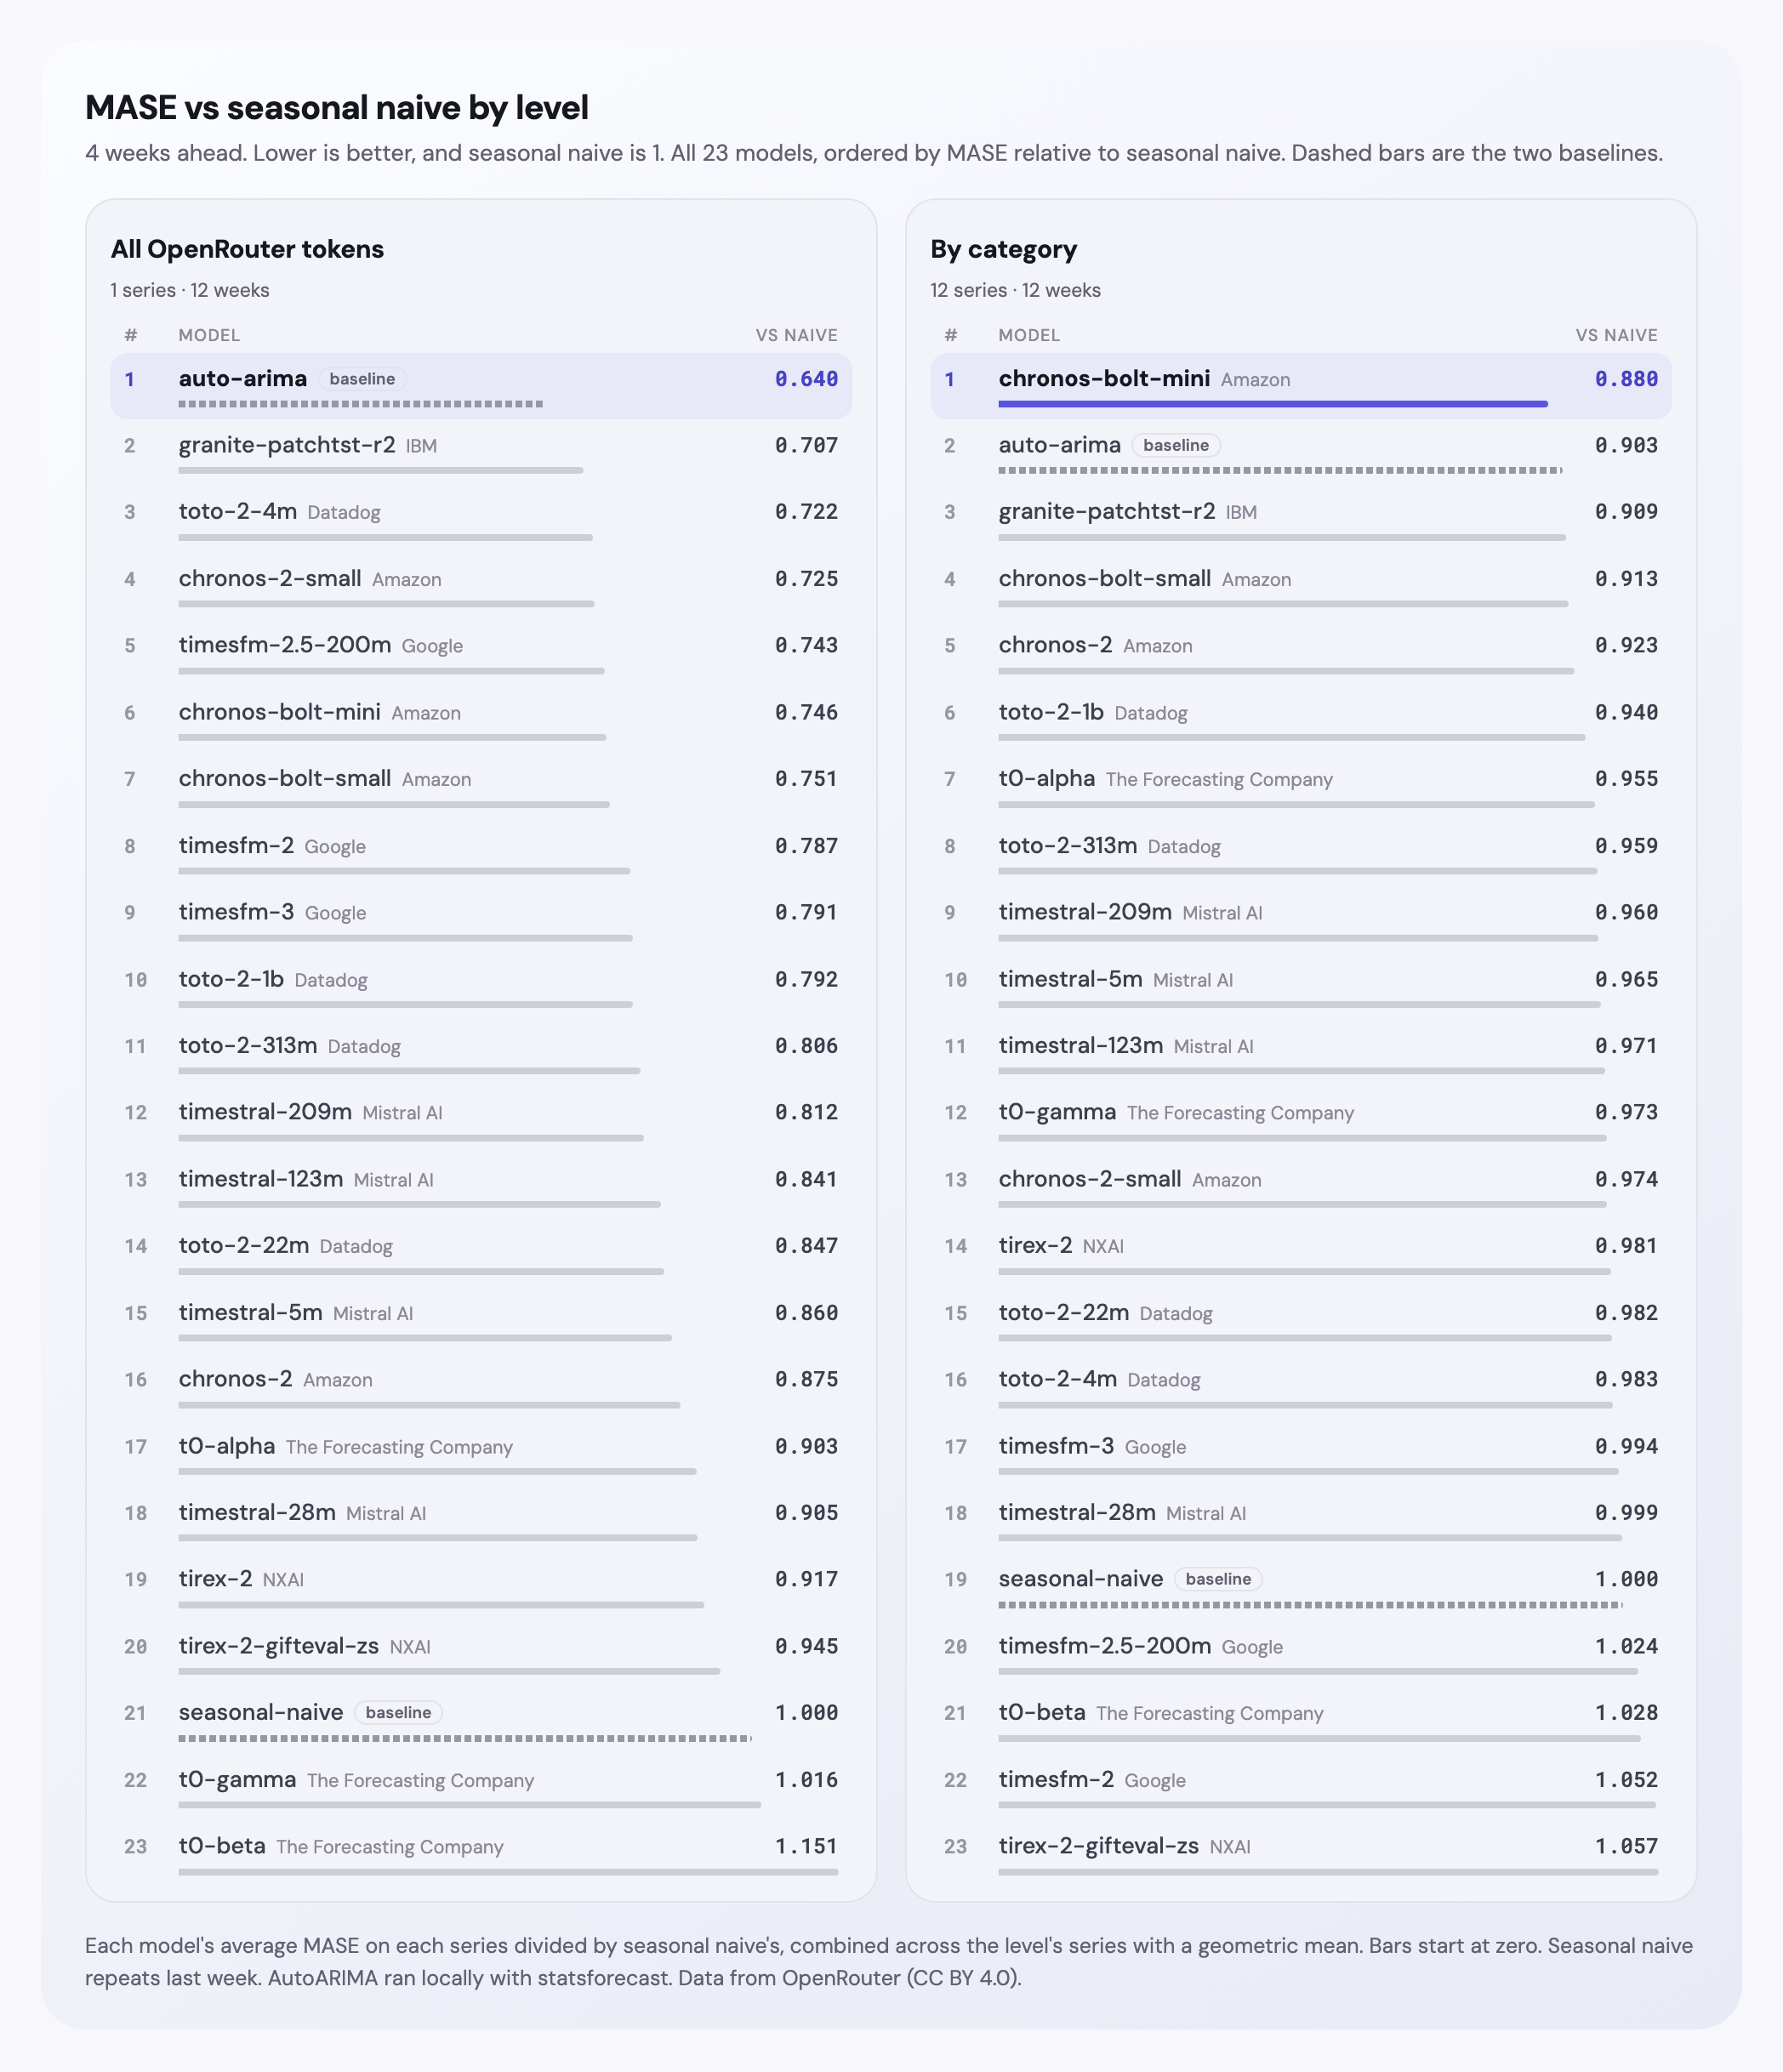
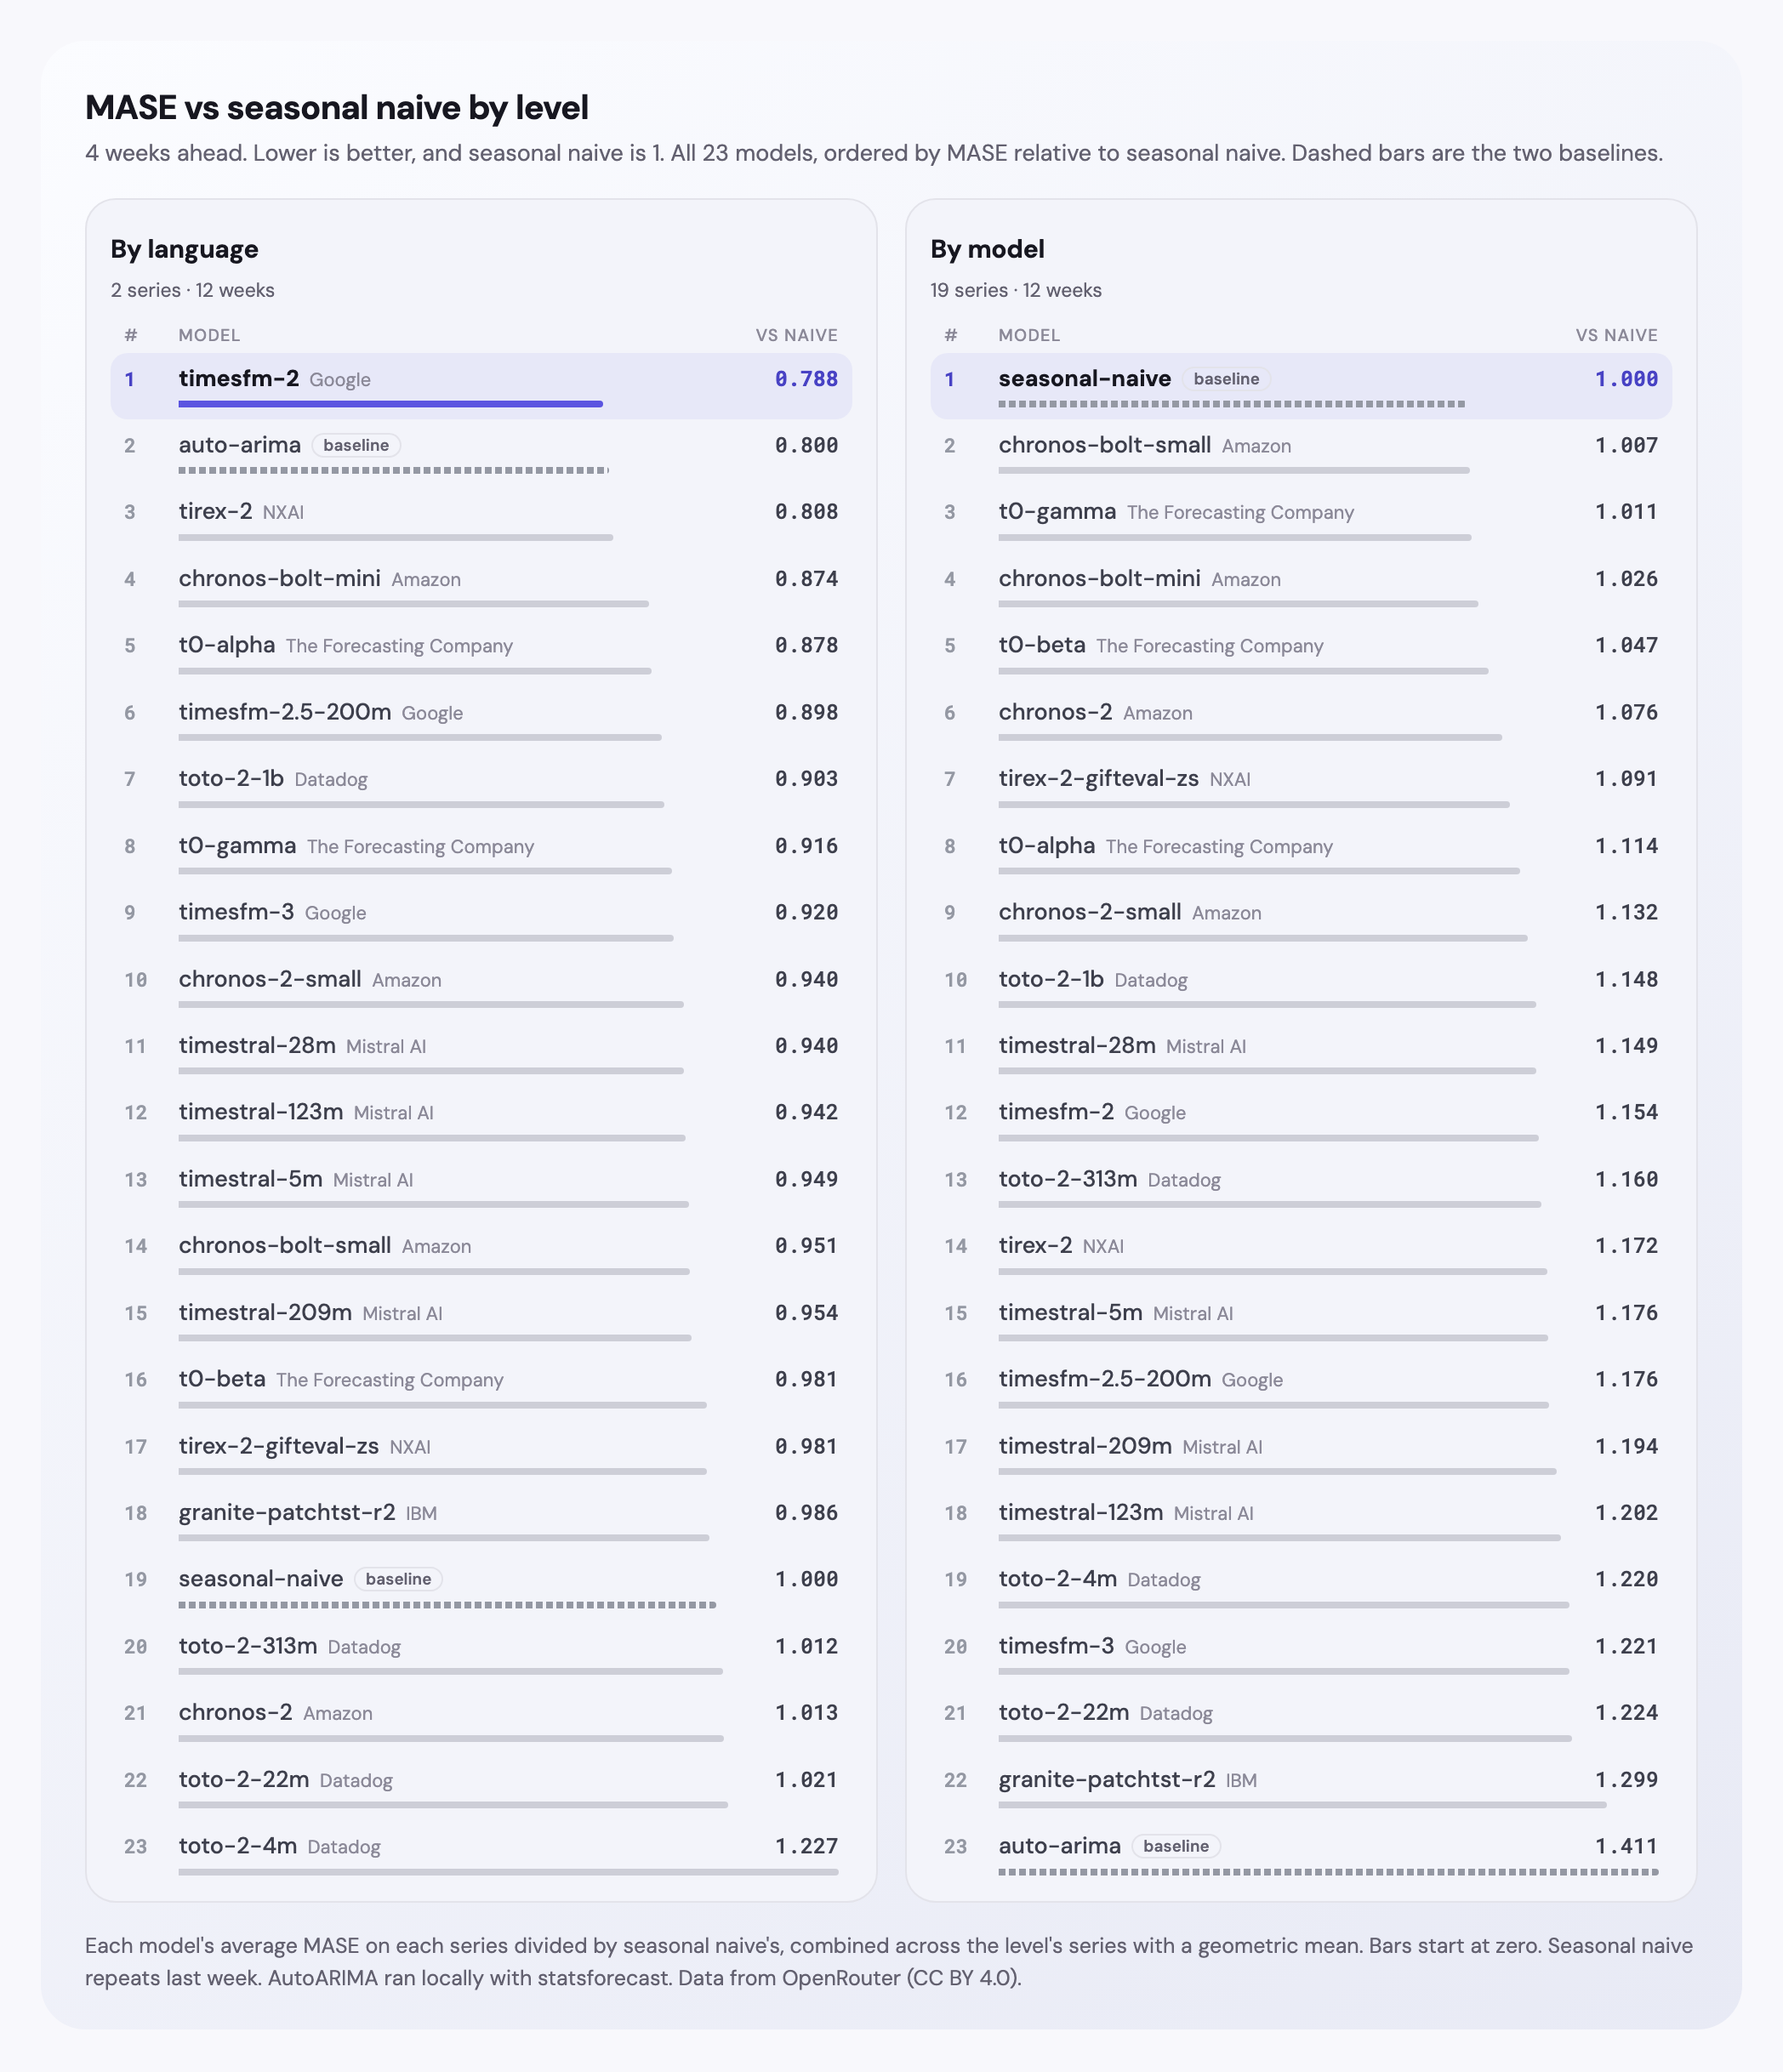
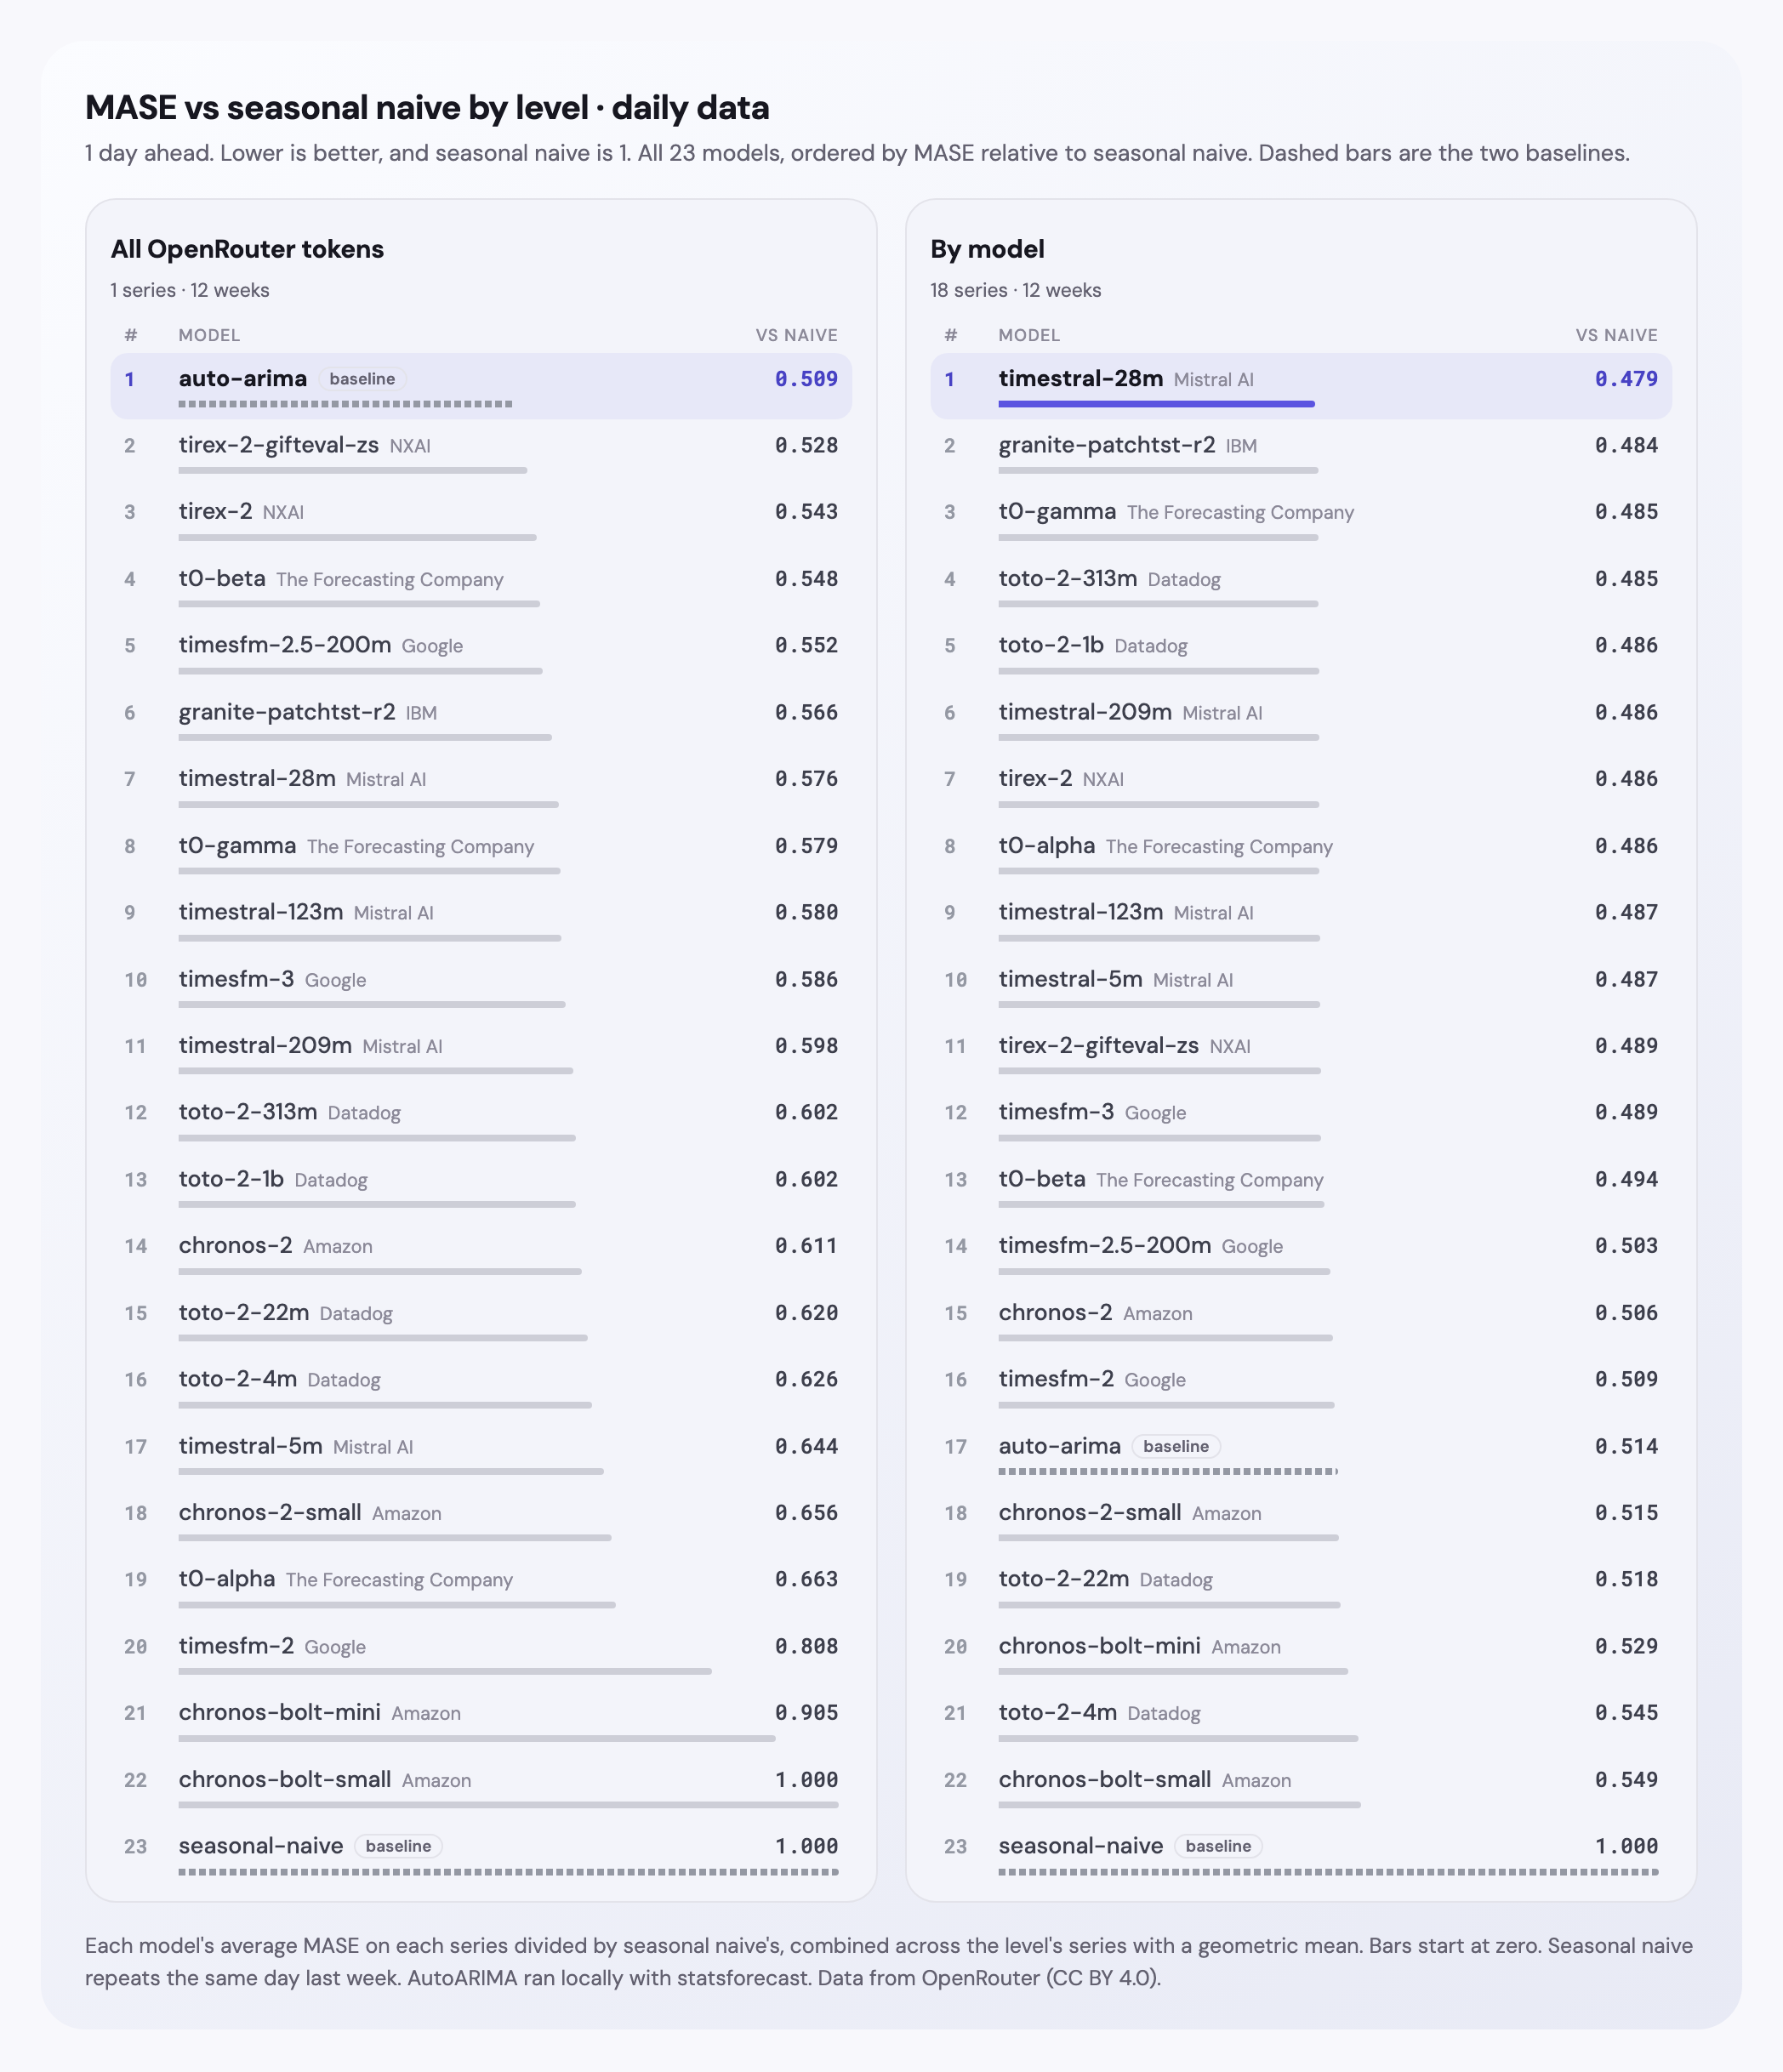
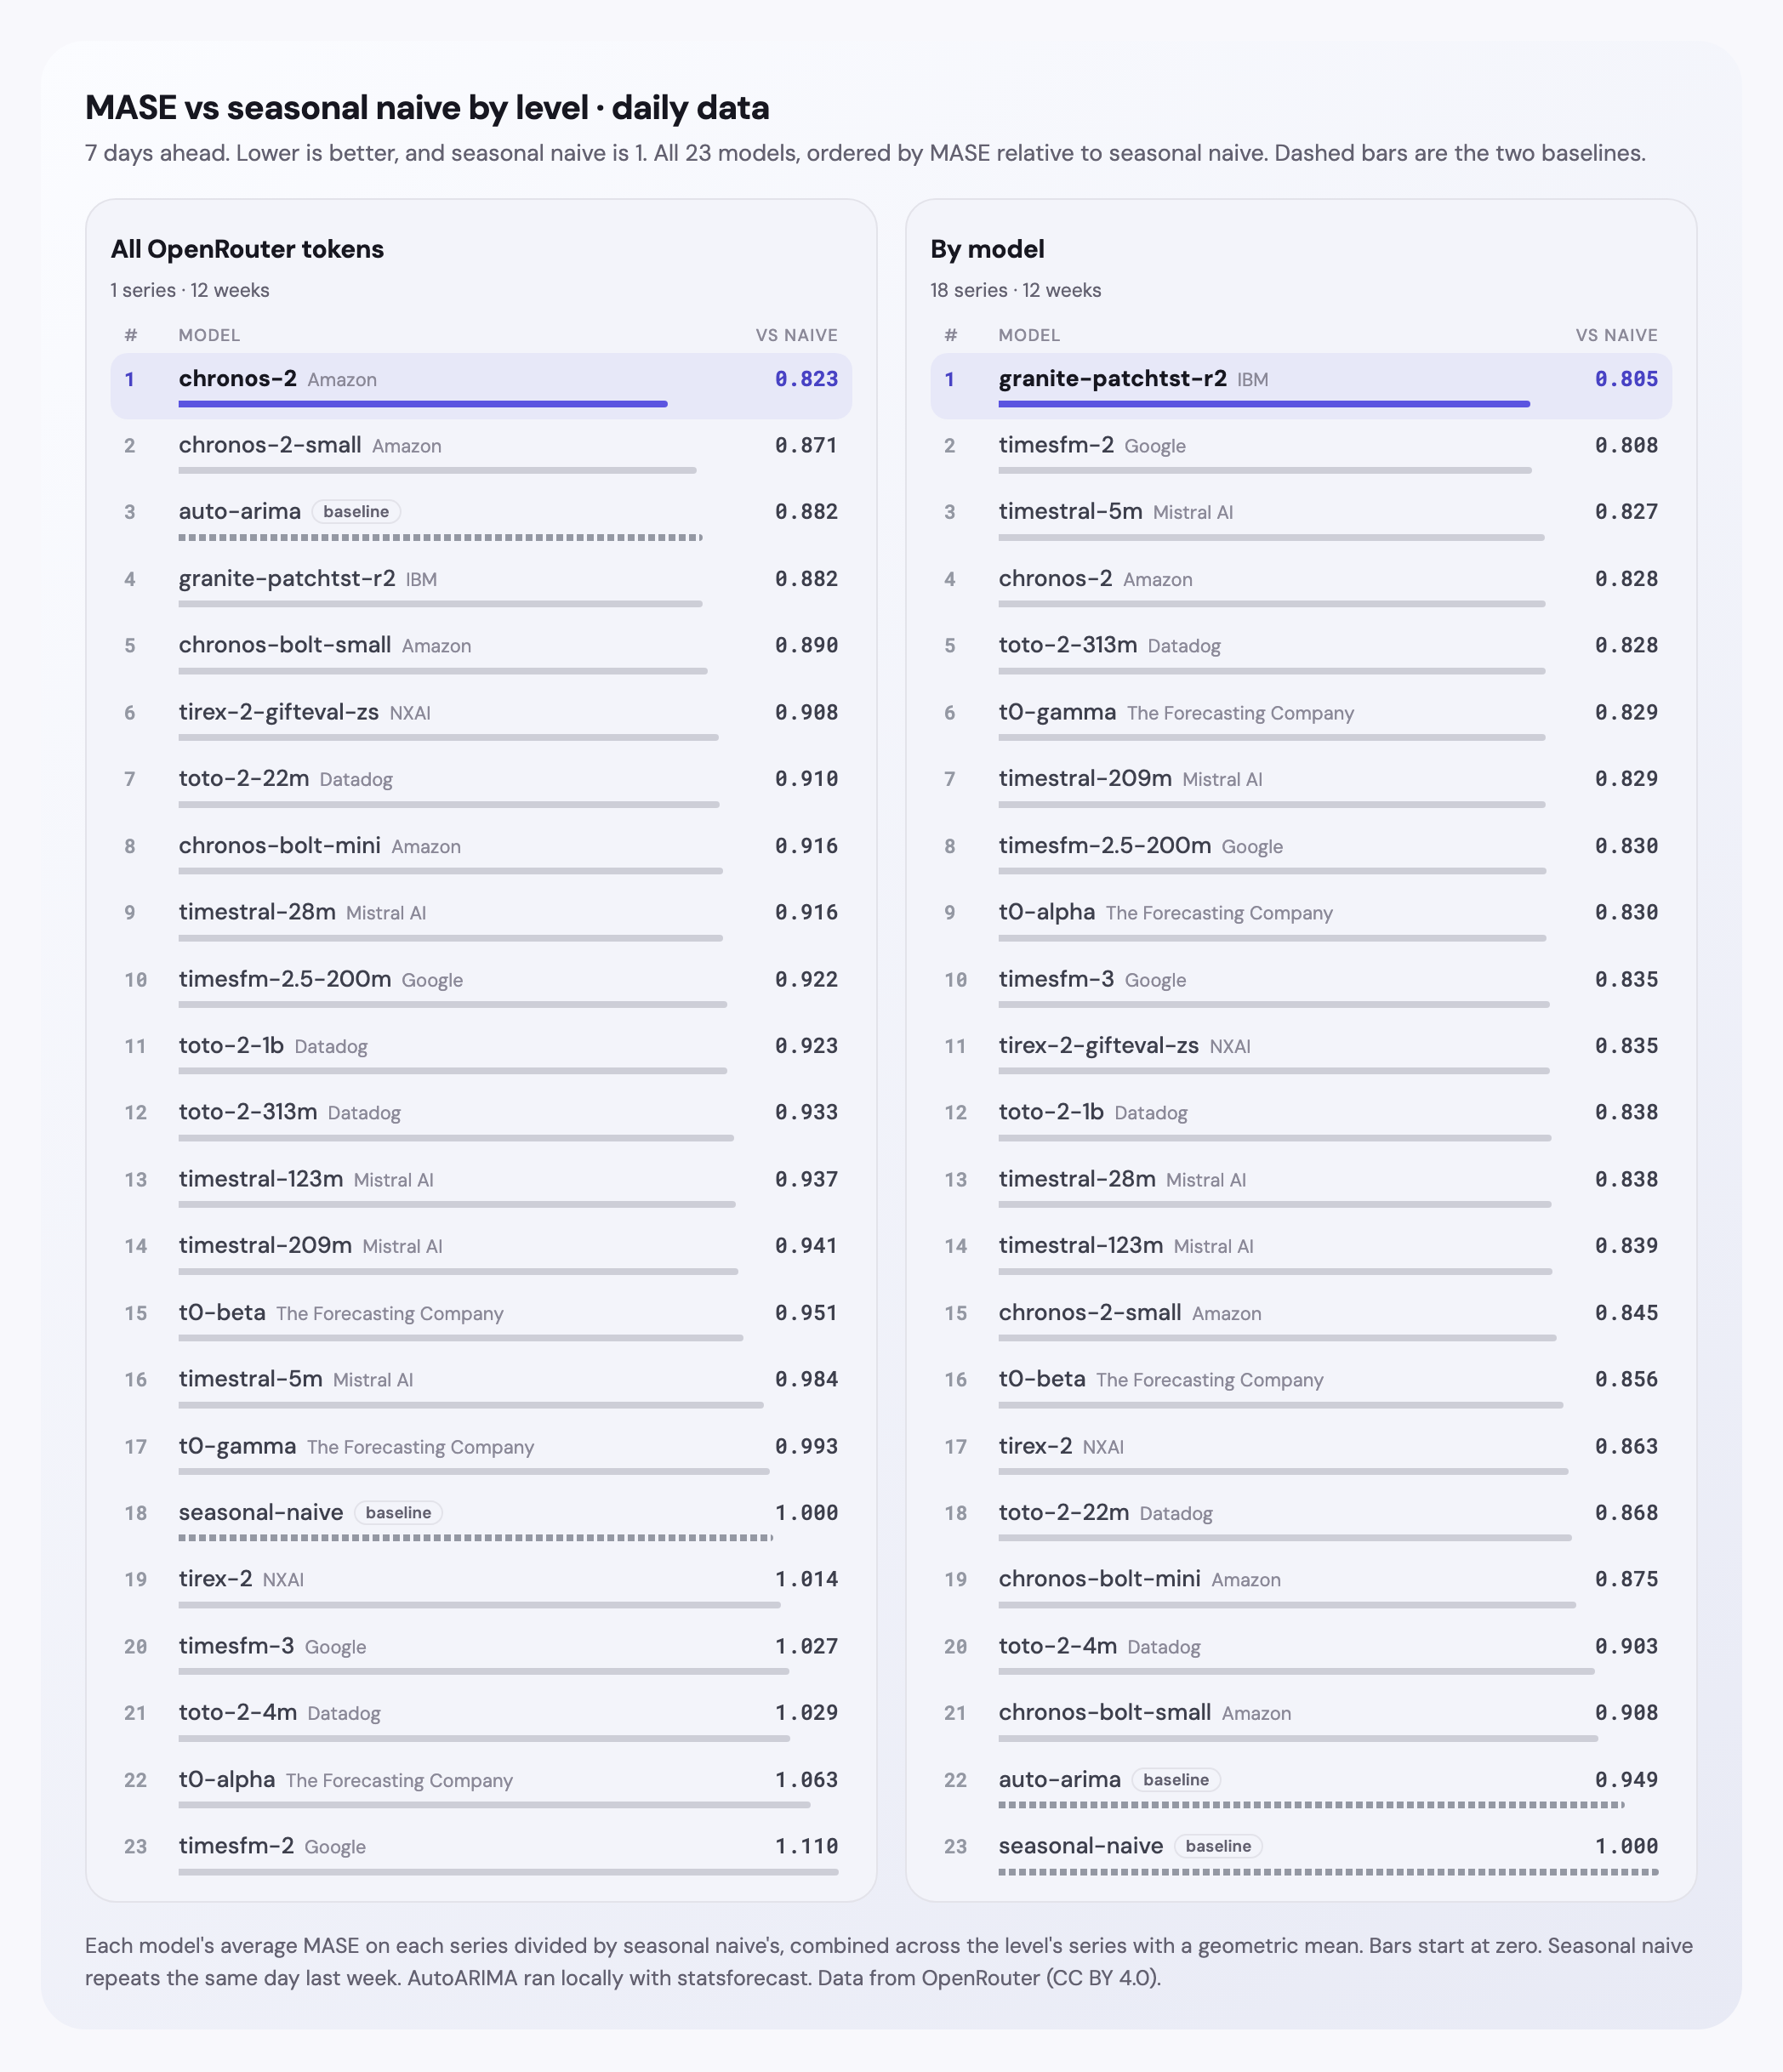
MASE vs seasonal naive by level
Lower is better, and seasonal naive is 1. All 23 models, ordered by MASE relative to seasonal naive. Dashed bars are the two baselines.
GIFT-Eval order vs OpenRouter order
The 21 models with a GIFT-Eval entry. Left is their GIFT-Eval order, right is their position out of 23 on OpenRouter. Dashed lines are the two baselines, and light grey names have no GIFT-Eval entry. Hover a line to follow a model.
fev-bench order vs OpenRouter order
The 16 models with a fev-bench entry. Left is their fev-bench order, right is their position out of 23 on OpenRouter. Dashed lines are the two baselines, and light grey names have no fev-bench entry. Hover a line to follow a model.
Notes
- Data comes from OpenRouter's public rankings (CC BY 4.0), pulled October 12, 2026. The last full week is October 5. Category and language numbers are OpenRouter's own estimates from sampled requests.
- MASE scales each forecast's average error by the average week-to-week change in that series' history up to the forecast week. Usage grew so much during the test weeks that raw MASE runs large (seasonal naive itself is about 6.6 on all tokens 1 week ahead), which is one more reason to report it relative to seasonal naive.
- All tokens is a single series, so its results vary more than the levels with many series.
- These results cover 12 weeks of one data source. A different period or a different domain could produce a different order.
- Models were called through the FoundationForecast API with default settings, weekly frequency and season length 1. AutoARIMA used statsforecast with season length 1.
- t0-gamma and the four Timestral sizes (5M, 28M, 123M and 209M) were added on October 20, 2026, after they reached the FoundationForecast API. GIFT-Eval and fev-bench results are from October 17 and October 16, 2026.
- Daily data comes from the same OpenRouter rankings, January 6, 2025 through October 13, 2026. OpenRouter has no daily rows for June 15 and July 15, 2025, so each is filled with the average of the day before and after. Both are months before the first cutoff. Daily seasonal naive and AutoARIMA use season length 7.
- Most of the 21 foundation models are transformer-based. TiRex 2 and its GIFT-Eval zero-shot version are the exceptions, built on xLSTM.
- Data, forecasts and code to reproduce every result are at github.com/TimeCopilot/experiments/tree/main/openroutertokens.
References
- Hyndman, R. J. (2026, August 25). Evaluating time series foundation model claims. Hyndsight. robjhyndman.com/hyndsight/foundation_models.html
- Bergmeir, C. (2024). LLMs and foundational models: Not (yet) as good as hoped. Foresight: The International Journal of Applied Forecasting, 73, 33-38. cbergmeir.com/papers/Bergmeir2024LLMs.pdf
- Meyer, M., Kaltenpoth, S., Zalipski, K., & Müller, O. (2025). Rethinking evaluation in the era of time series foundation models: (Un)known information leakage challenges. arXiv:2510.13654. arxiv.org/abs/2510.13654
- Aksu, T., Woo, G., Liu, J., Liu, X., Liu, C., Savarese, S., Xiong, C., & Sahoo, D. (2024). GIFT-Eval: A benchmark for general time series forecasting model evaluation. arXiv:2410.10393. arxiv.org/abs/2410.10393 Leaderboard and results at huggingface.co/spaces/Salesforce/GIFT-Eval
- Shchur, O., Ansari, A. F., Turkmen, C., Stella, L., Erickson, N., Guerron, P., Bohlke-Schneider, M., & Wang, Y. (2025). fev-bench: A realistic benchmark for time series forecasting. arXiv:2509.26468. arxiv.org/abs/2509.26468 Results at github.com/autogluon/fev
- Pichai, S. (2026, May 19). I/O 2026: Welcome to the agentic Gemini era. Google. blog.google/innovation-and-ai/sundar-pichai-io-2026/
- Microsoft. (2026, January 28). FY26 Q2 earnings conference call transcript. cdn-dynmedia-1.microsoft.com/is/content/microsoftcorp/TranscriptQandAFY26q2
- Aubakirova, M., Atallah, A., Clark, C., Summerville, J., & Midha, A. (2026). State of AI: An empirical 100 trillion token study with OpenRouter. a16z and OpenRouter. arXiv:2601.10088. arxiv.org/abs/2601.10088
- Bai, L., Huang, Z., Wang, X., Sun, J., Mihalcea, R., Brynjolfsson, E., Pentland, A., & Pei, J. (2026). How do AI agents spend your money? Analyzing and predicting token consumption in agentic coding tasks. arXiv:2604.22750. arxiv.org/abs/2604.22750
- Cottier, B., Snodin, B., Owen, D., & Adamczewski, T. (2025, March 12). LLM inference prices have fallen rapidly but unequally across tasks. Epoch AI. epoch.ai/data-insights/ai-inference-price-trends
- Hyndman, R. J., & Koehler, A. B. (2006). Another look at measures of forecast accuracy. International Journal of Forecasting, 22(4), 679-688. robjhyndman.com/papers/mase.pdf
- Williams, A. R., Ashok, A., Marcotte, É., Zantedeschi, V., Subramanian, J., Riachi, R., Requeima, J., Lacoste, A., Rish, I., Chapados, N., & Drouin, A. (2024). Context is Key: A benchmark for forecasting with essential textual information. arXiv:2410.18959. arxiv.org/abs/2410.18959
- Garza, A., Rosillo, R., Mendoza-Smith, R., Salinas, D., Williams, A. R., Ashok, A., Goswami, M., & Juárez, J. M. (2026). Impermanent: A live benchmark for temporal generalization in time series forecasting. arXiv:2603.08707. arxiv.org/abs/2603.08707